The ei3 Mobile Portal puts factory floor productivity at your fingertips. Stay informed about what’s happening on the production floor – no matter where you are.
Download the ei3 Mobile Portal on the App Store or the Play Store


- Open the App Store or the Play Store on your phone.
- Search for Mobile Portal for ei3, then tap Get/Install to download and install the app.
- Once installed, Open the ei3 app on your device and enter your ei3 credentials to log in.
1. After logging in, you’ll be directed to a page showing all the machines at that site. Scroll through the list and click on your desired machine for further viewing.
2. Upon selection, you will see the machine’s details such as Downtime/Uptime since last stop, OEE, material produced, and speed. To easily switch between machines, click on the arrows at the bottom of your screen, as shown above.
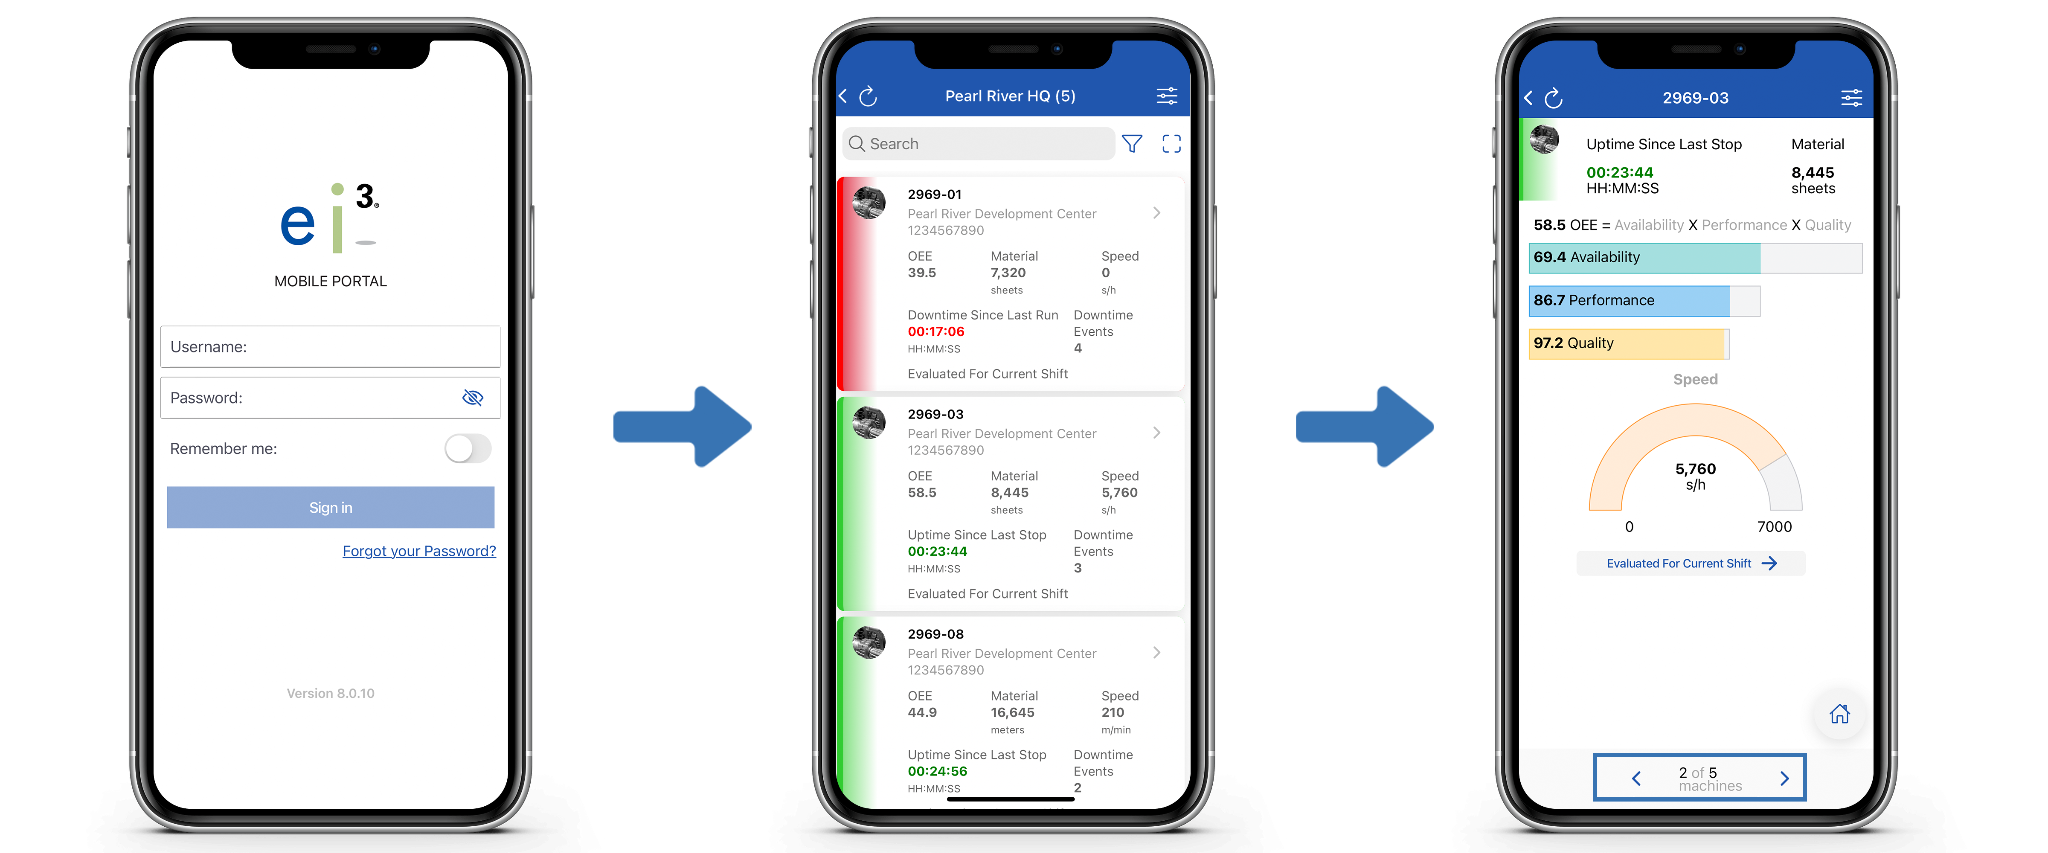
3. Clicking on the button named Evaluated For allows you to view the machine’s data for either the current shift, current job, or last 24 hours.
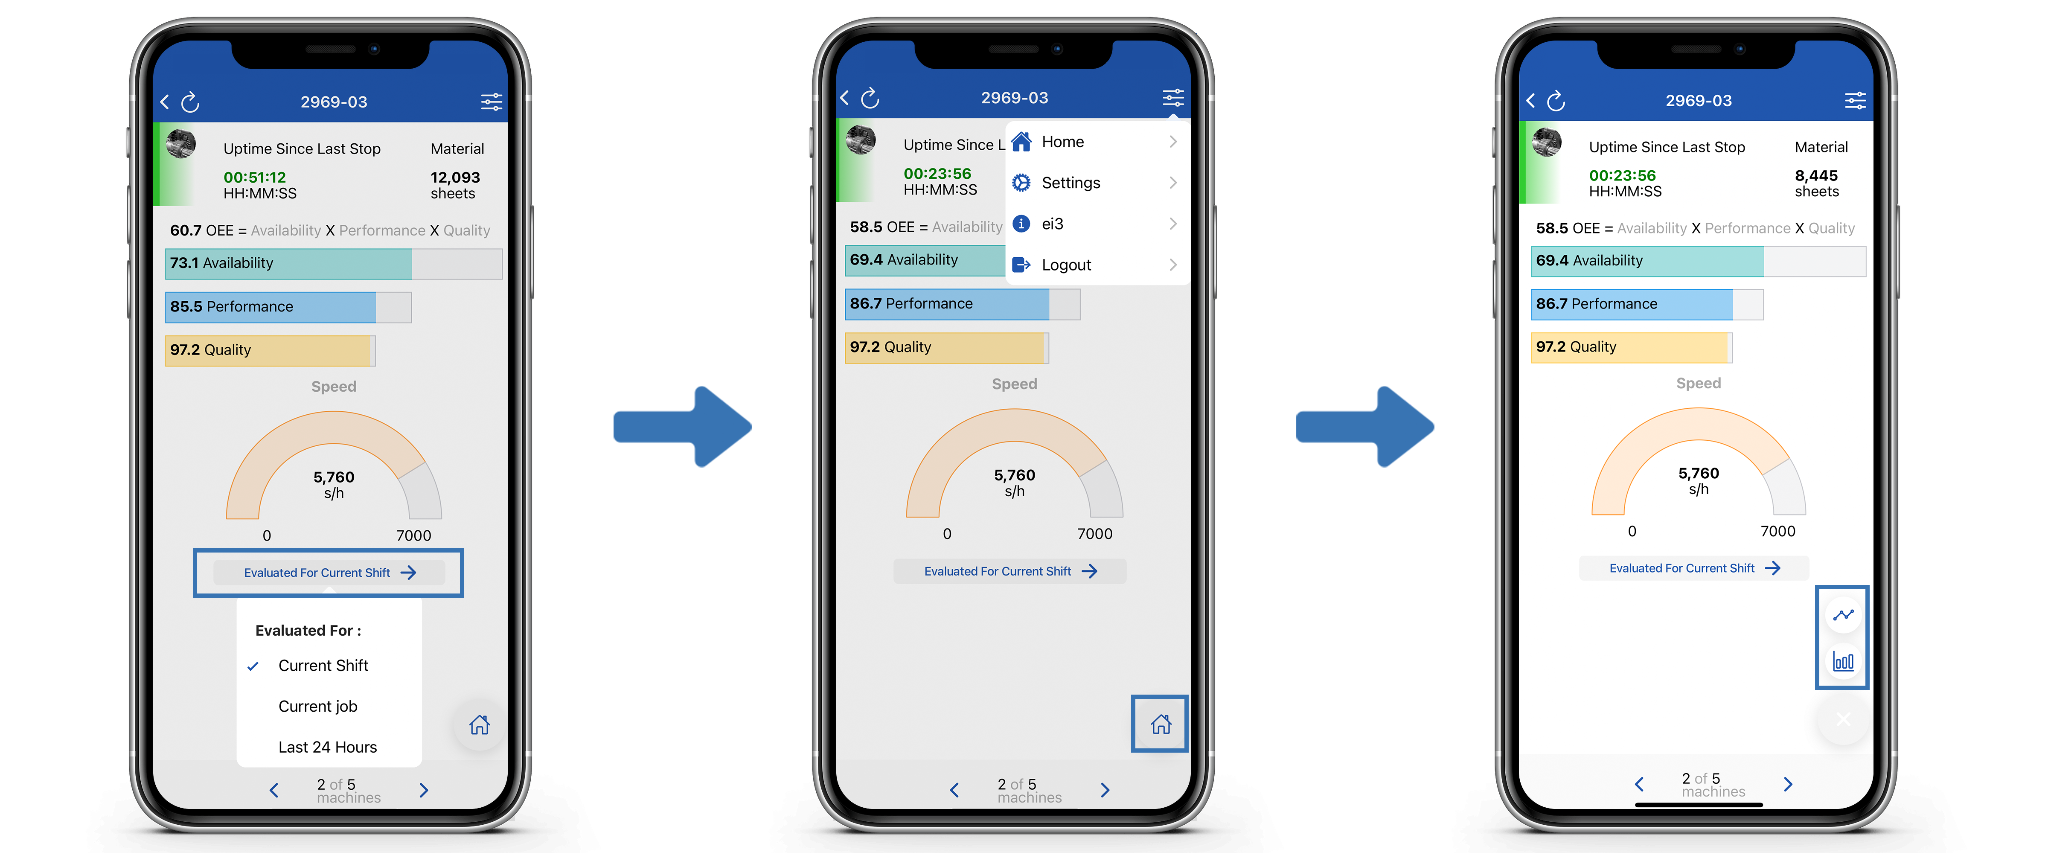
4. Click on the ![]() icon in the top right corner of your screen to access a dropdown menu. From here you can:
icon in the top right corner of your screen to access a dropdown menu. From here you can:
- Click Home to return back to the home screen showing the “Machine Locations”,
- Click Settings to enter the app settings
- View the ei3 “About” page
- Logout – as shown earlier
5. Clicking on the home icon ![]() in the bottom right corner of the screen will generate two more options, the Line Graphs icon
in the bottom right corner of the screen will generate two more options, the Line Graphs icon ![]() and the Control Charts icon
and the Control Charts icon ![]() .
.
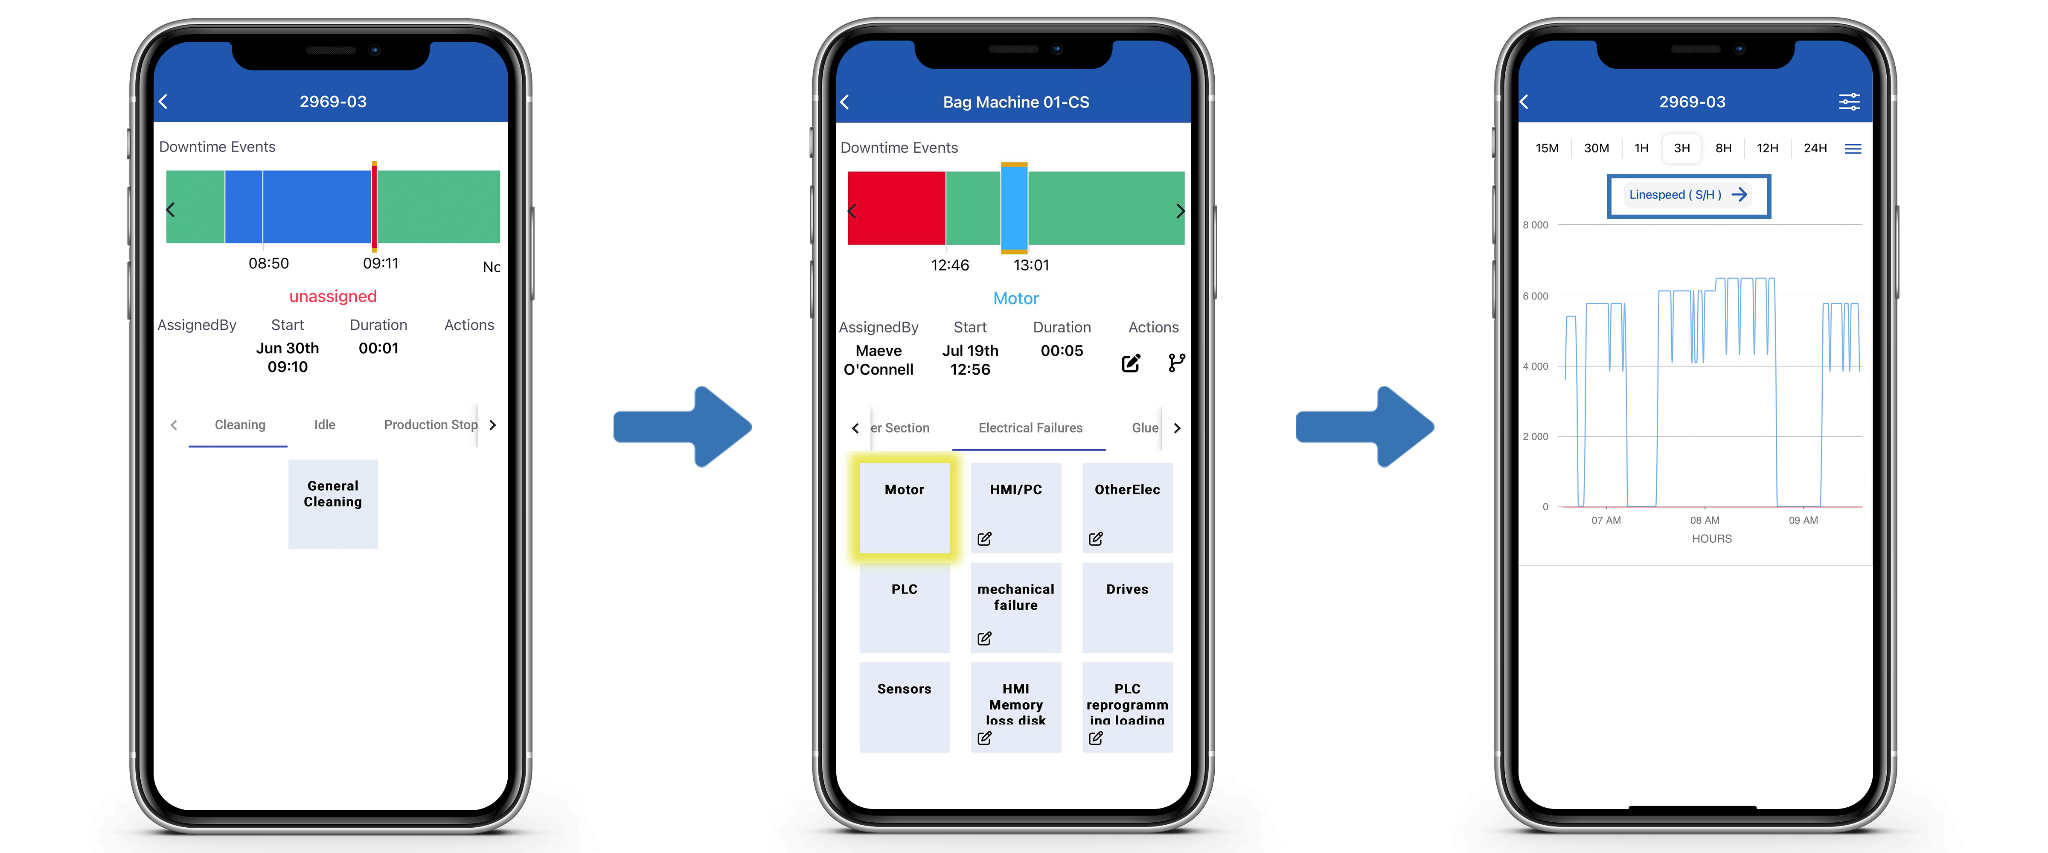
Selecting the Line Graphs icon ![]() will bring you to the “Downtime Events” page, where you can access the machine’s downtime details. Scroll through the timeline graphic to view the details, where green represents uptime, blue represents assigned downtime, and red represents unassigned downtime. Additionally, at the bottom of the screen you can also view the specific assigned reasons for downtime.
will bring you to the “Downtime Events” page, where you can access the machine’s downtime details. Scroll through the timeline graphic to view the details, where green represents uptime, blue represents assigned downtime, and red represents unassigned downtime. Additionally, at the bottom of the screen you can also view the specific assigned reasons for downtime.
If you want to Assign Downtime to a Red unassigned section, simply click on that section, then scroll through the specific assigned reasons or Downtime and select the reason. After selection the screen will update and that section will turn into a Light Blue user assigned section.
Clicking on the Control Charts ![]() icon will bring you to the machine’s data points, displayed graphically. You can change which data points you wish to view using the right arrow
icon will bring you to the machine’s data points, displayed graphically. You can change which data points you wish to view using the right arrow ![]() icon.
icon.
LIFECYCLE
If applicable, your machine may have an option to view its LIFECYCLE Data. From step 5, clicking on the home icon ![]() in the bottom right corner of the Machine page will make a third icon
in the bottom right corner of the Machine page will make a third icon ![]() appear. Clicking on this icon will bring you into the machine’s LIFECYCLE Information.
appear. Clicking on this icon will bring you into the machine’s LIFECYCLE Information.
This first tab is named Maintenance and allows you to see the Tools, Parts, and Assemblies in the machine, and selecting one will expand it so you can view its data. You can see the Last Maintenance performed, the Time Elapsed since Last Maintenance, as well as the time until Next Maintenance.
You can also Perform Maintenance by selecting the ![]() icon, and then Add a Note by selecting the
icon, and then Add a Note by selecting the ![]() icon.
icon.
To switch between tabs, scroll through them using the left and right arrows at the top then select its name.
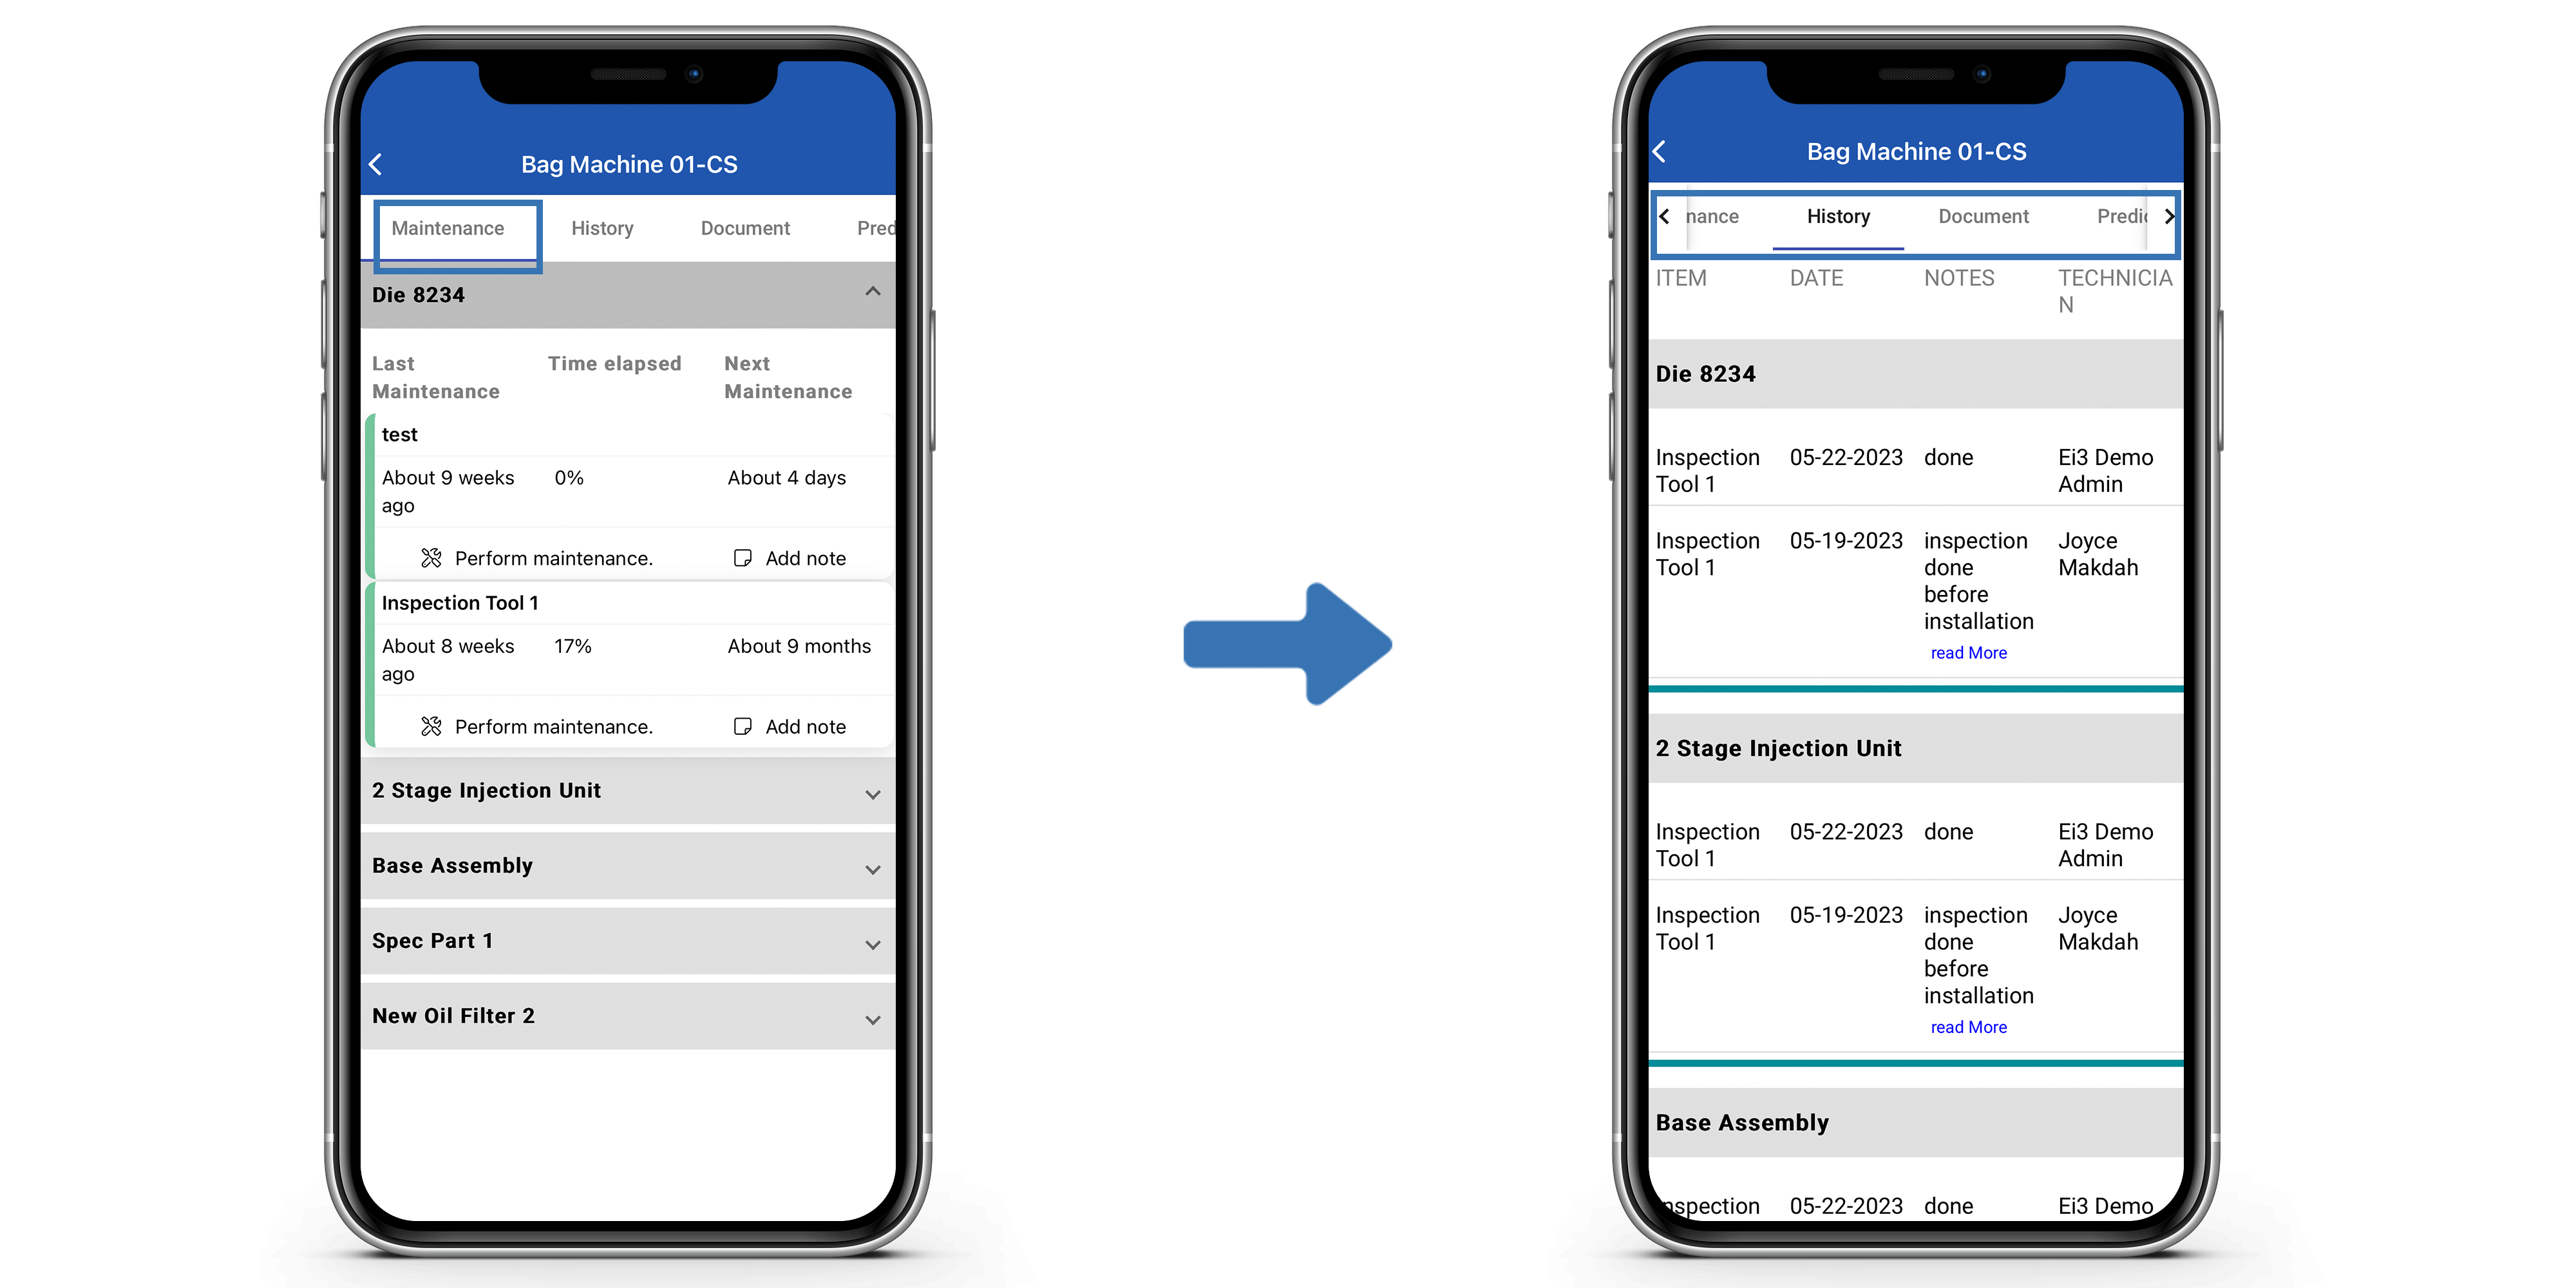
The next tab, shown above, is named History, and here you can view past Maintenance on the machine’s Items including what maintenance was performed, the Date, any Notes added, and which Technician performed it.
The third tab, shown below, is named Document, and this section allows you to Upload Resources to each Item of that machine.
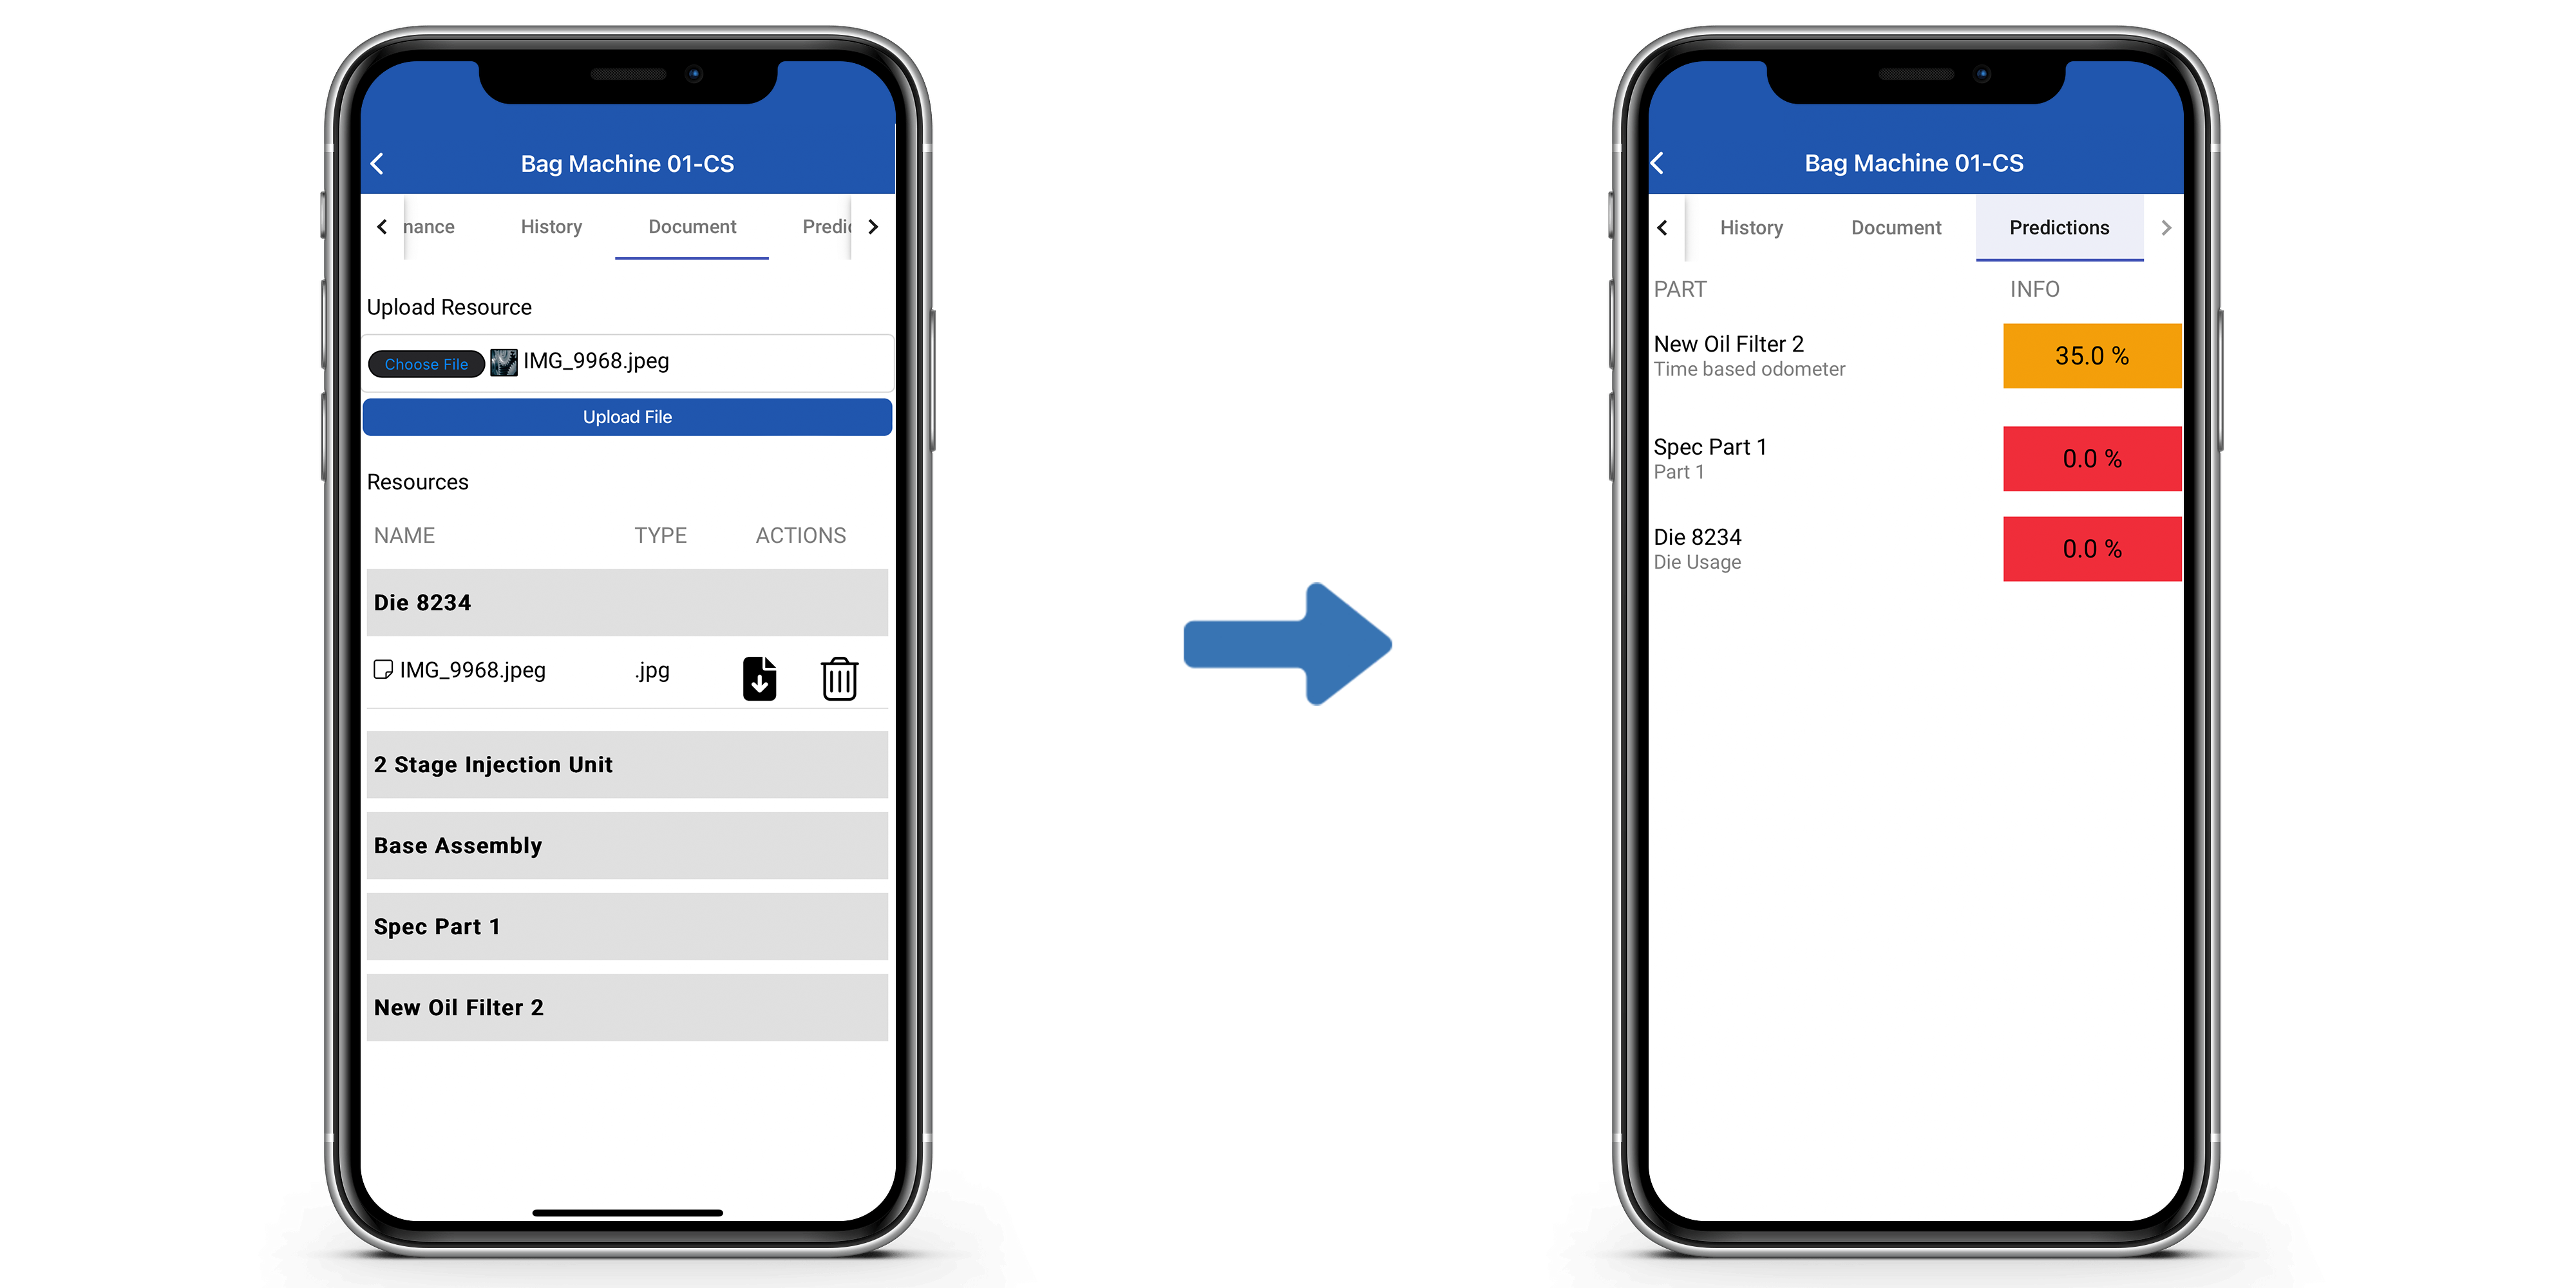
The fourth and final tab, shown above, is named Predictions. Here you can view the Lifecycle Status information for the Parts of that machine, shown in percentages. A Red percentage indicates a Critical Status, an Orange indicates Severe, and a Green indicates OK.
© 2023 ei3 Corporation. Content of this web page is proprietary to ei3 Corporation.
