Before creating Machine State badges, make sure that your Machine States have been defined, and shift schedules have been entered by your administrator.
This article describes the Machine State badges available in dashboards that are displayed on the INSIGHTS Overview page in ei3. The badges display the four different states a machine could be in (Execute, Suspended, Stopped, and Held). You can choose to view the data in either a Tree Map or a Pareto chart, and then you can switch between the layouts using the following toggle, located in the top-right corner of the Overview page:

Keep reading to learn more about the different types of Machine State badges!
How to Create a Machine State Badge
On the INSIGHTS Overview page, first select the Edit button ![]() in the top right corner, then the Add Badge button
in the top right corner, then the Add Badge button ![]() . A window like the one below will appear, where you can select the machine you wish to add a badge for using the dropdown menu.
. A window like the one below will appear, where you can select the machine you wish to add a badge for using the dropdown menu.

After selecting the machine you wish to use, another dropdown menu will appear, where you can select the Badge Type. Select “Machine State”.

After selecting Machine State, two more dropdown menus will appear where you can select what it will be Evaluated By (Last 4, 8, 12, or 24 hours, Current Shift, or Current Job), and then the Chart Type (Tree Map or Pareto). You can select either Tree Map or Pareto, depending on how you wish to view the Machine State details. When you’re done, press the Submit button ![]() for your Machine State badge to appear on the Dashboard.
for your Machine State badge to appear on the Dashboard.

Tree Map Badge
Tree Map Large Badge
The first chart option for a Machine State badge that you could choose is the Tree Map, as seen below.

The Tree Map badge is a chart style displaying the amount of time the Machine was in the states of Execute, Suspended, Stopped, and Held, using rectangles of decreasing sizes that correlate with the percentage of time for each category. As seen in the image below, hovering over each category will display the amount of time and percentage for that category.

Tree Map Small Badge

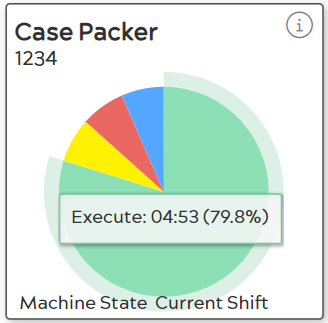
Machine State Tree Map badges shown in the Small Grid layout display the same data but in a Pie Chart form. Just like the Large badge, the Small one’s categories correlate with the amount of time the Machine was in each State. Hovering over a particular category will show the Machine State, Duration, and Percentage.
Tree Map Table Layout Badge

The Machine State Table Layout badge for the Tree Map chart contains all the information as the Large Badge but in a thin bar displaying the Machine States in chronological order. Hovering over each Machine State will show the Machine State, Duration, and Start Time.
Tree Map Factory Layout Badge

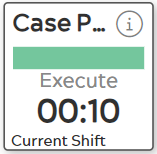
Machine State Tree Map badges displayed in the Factory Layoutsimply show what the Machine State currently is. As seen in the example above, the machine has been in the “Execute” state for 10 minutes.
Pareto Badge
Pareto Large Badge
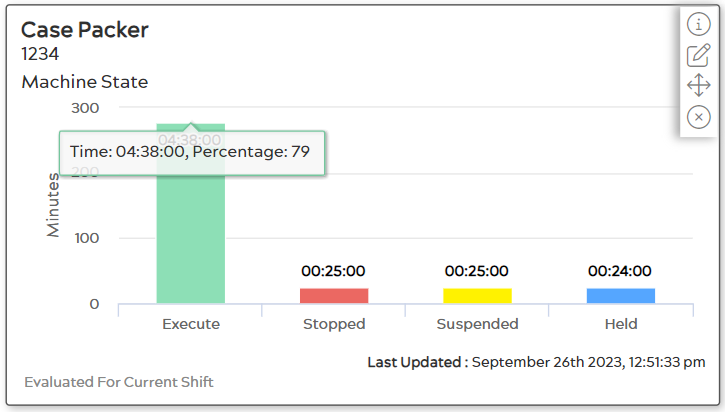
The first chart option for a Machine State badge that you could choose is the Pareto chart, as seen below (in Large badge form).

The Pareto chart badge is a chart style displaying the amount of time the Machine was in the states of Execute, Suspended, Stopped, and Held, in a bar graph style of decreasing sizes that correlate with the percentage of time for each category. Unlike the Tree Map, the Pareto chart always shows the amount of time for each category. As seen in the image below, hovering over each category will display the amount of time and percentage for that category, just like the Tree Map.

Pareto Small Badge

Machine State Pareto badges shown in the Small Grid layout display the data in a Pie Chart form. This badge looks exactly like the Small badge for the Tree Map chart. Just like the Large badge, the Small one’s categories correlate with the amount of time the Machine was in each State. Hovering over a particular category will show the Machine State, Duration, and Percentage.
Pareto Table Layout Badge

The Machine State Table Layout badge for the Pareto chart is the same as the Tree Map chart and contains all the information as the Large Badge but in a thin bar displaying the Machine States in chronological order. Hovering over each Machine State will show the Machine State, Duration, and Start Time.
Pareto Factory Layout Badge

Machine State Pareto badges displayed in the Factory Layout are the same as the Tree Map chart and simply show what the Machine State currently is. As seen in the example above, the machine has been in the “Execute” state for 10 minutes.

