Before creating Downtime badges, make sure that your machine has the DOWNTIME application enabled, and shift schedules have been entered by your administrator.
To learn more about DOWNTIME, visit this article: DOWNTIME- Overview – ei3 Knowledge Database
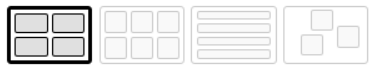
This article describes the Downtime badges available in dashboards that are displayed on the INSIGHTS Overview page in ei3. The badges display all the downtime data for the machine you select. You can switch between the layouts using the following toggle, located in the top-right corner of the Overview page:
Keep reading to learn more about the different types of Downtime badges!
How to Create a Downtime Badge
On the INSIGHTS Overview page, first select the Edit button ![]() in the top right corner, then the Add Badge button
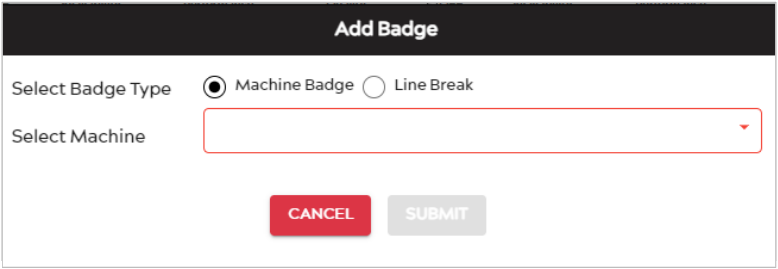
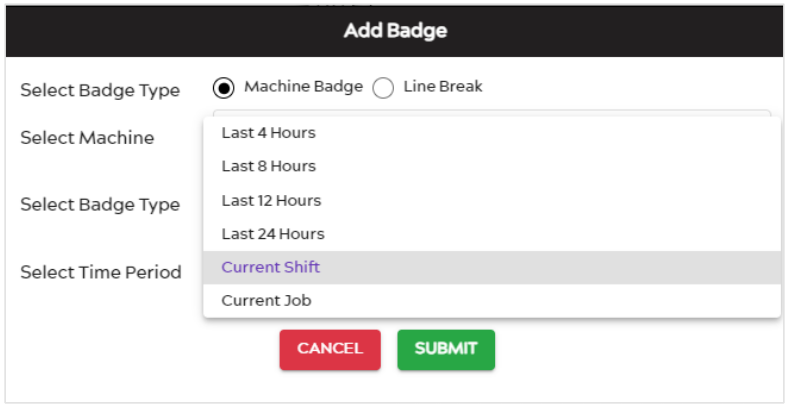
in the top right corner, then the Add Badge button ![]() . A window like the one below will appear, where you can select the machine you wish to add a badge for using the dropdown menu.
. A window like the one below will appear, where you can select the machine you wish to add a badge for using the dropdown menu.
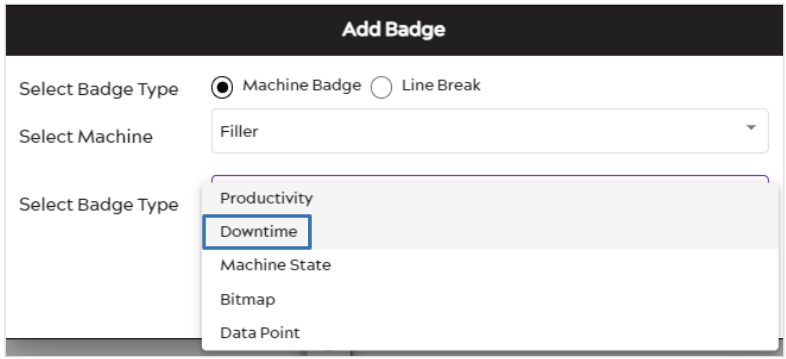
After selecting the machine you wish to use, another dropdown menu will appear, where you can select the Badge Type. Select “Downtime”.
After selecting Downtime, another dropdown menu will appear where you can select the Time Period (Last 4, 8, 12, or 24 hours, Current Shift or Current Job). When you’re done, press the Submit button ![]() for your Data Point badge to appear on the Dashboard.
for your Data Point badge to appear on the Dashboard.
Downtime Badge Types
Large Badge
In the example below, a Large Downtime badge displays the downtime for the selected machine in a chronological bar. The sections where it is Green means its Running, Red means Unassigned Downtime, and Blue means Assigned Downtime.
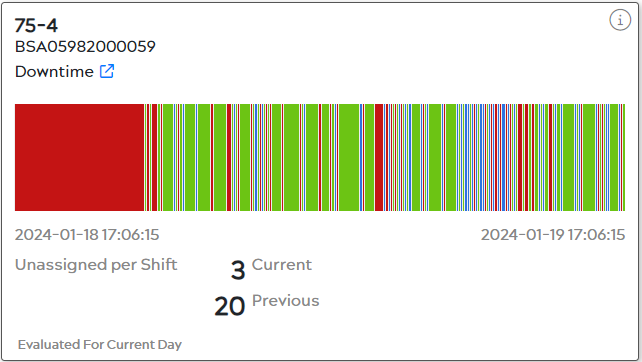
As seen above, the Large badge for Downtime also displays the Machine Name, Start and End Date and Time, how many Unassigned Downtimes occurred in the Current and Previous Shifts, and then the Time Period at the very bottom. Hovering over any section on the bar will show you the Code, Duration, and Start Time.
Small Badge
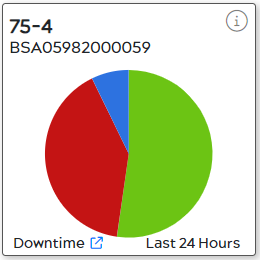
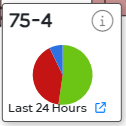
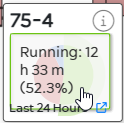
Downtime badges shown in the Small Grid layout display the same data but in a Pie Chart form. Just like the Large badge, the Small one’s categories correlate with the downtime codes, except in this format, all the codes are grouped together rather than separated into chronological order. The colors are the same as the Large badge with Green as Running, Red as Unassigned Downtime, and Blue as Assigned Downtime. Hovering over a particular category will show the Downtime Code, Duration, and Percentage that code occurred in relation to the entire time range.
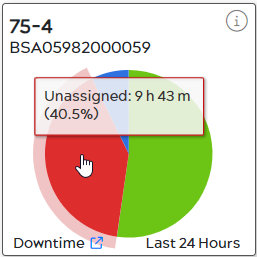
Table Layout Badge

The Downtime Table Layout badge contains all the information as the Large Badge but in the form of a thin bar. The graphic on it is the exact same and hovering over the graphic will display the same information as the Large badge.
Factory Layout Badge
The Factory Layout badge for Downtime simply shows the Machine Name, the Time Period (Current Shift), and the same pie chart as the Small badge, just even smaller. Hovering over the pie chart acts the same way the Small badge did, displaying the same information, as seen below.
Links to DOWNTIME Application
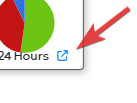
Every Downtime badge contains a small blue icon ![]() representing a link. When you click this icon, the DOWNTIME > Assign page will load, allowing you to manage downtime for the machine.
representing a link. When you click this icon, the DOWNTIME > Assign page will load, allowing you to manage downtime for the machine.