Alerts & Reports
Check to make sure that the email addresses and phone numbers specified in the Recipients section are correct.
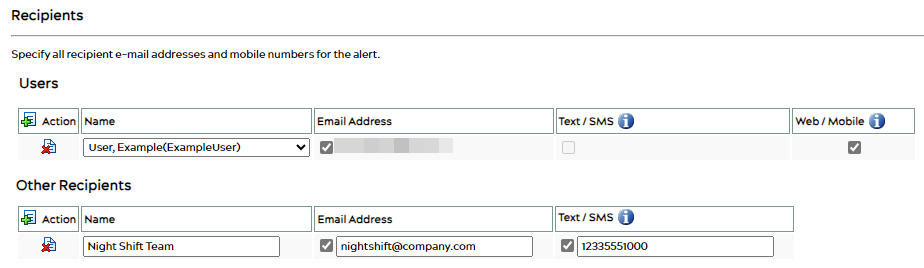
For SMS / text recipients, make sure you have included the recipient’s country code prefix before their phone number – no spaces or non-numerical characters.
If you wanted to add a number in Switzerland, for example, you would need to pre-pend the country code for Switzerland (+41), so if a Swiss cell phone was 79-xxx-xx-xx, you would enter that as 4179xxxxxxx.
Note: Text messaging charges may apply.
See Viewing, Sharing, & Saving Reports for more details on report sharing.
You can configure the system to send out an Email or Text message when a connection has been off for more than X number of minutes.
In the Remote Service Platform, navigate to the Admin -> Networks page, and select the bell icon ![]() under the Configure column to open the Alerts page.
under the Configure column to open the Alerts page.
On the Alerts page you can configure when the first alerts gets sent, if/when additional alerts are sent, max number of alerts to send (up to 60), and if a resolution email get sent.
For more information on alerts and alert setup, click here.
Ei3 provides various alerts in the Remote Service Platform, and in the Customer Portal. Alerts are available in the Customer Portal for Remote Monitoring, Downtime Tracking (if said products are active on the selected machine), and in the Remote Service Platform for network and machine connectivity. Each alert page has an Options field which lets you specify the alert conditions such as frequency, duration between, and max number of alerts. The fields are shown and explained below:
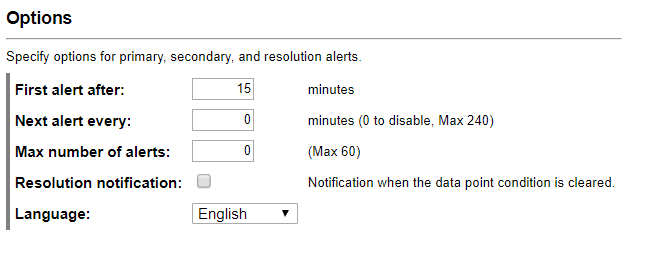
First alert after: Whether the alert is for an Amphion coming online or going offline, for remote monitoring data, or for downtime tracking, an alert can be configured to be sent out after a certain duration from the initial time of occurrence.
The number in this text field matches exactly how many minutes after the alert condition is met that the alert will be sent to the recipients. If this field is set to zero, the alert will be sent out immediately (at the time of alert condition occurrence). If set to 10, for example, the alert will be sent 10 minutes from the initial alert occurrence, and will only be sent if the alert condition remains in that state for the complete 10 minutes.
Next alert every: The number in this field will set the alert to be re-sent after a certain amount of time. If the number here is 15, for instance, another alert will be sent after 15 minutes from the first one, if the alert conditions are still met.
Max number of alerts: This field allows you to limit the number of alerts which are sent out, after the first, assuming alert conditions are still met. For example, if this field was set to 1, and an alert was sent out, another alert would be sent to the recipients later (based on the time period set in the Next alert every field). If the condition remained for additional time, the alert would not be sent because of the specified max number of alerts being set to 1.
You can think of this field as being titled Max number of additional alerts as it is only counting the alerts being sent out after the first alert.
You can read more about setting up alerts in these articles:
ei3’s Downtime Tracking allows admin users to change downtime periods on any machine to be listed instead as uptime (run time). Doing this ‘deletes’ a downtime period and instead treats it as machine runtime when calculating machine OEE. Whenever a change like this is made, ei3 keeps a historical record of it for reference. It is possible to get a list of all changes of this nature in a report that you can refer to at any time.
In the Customer Portal, select Reports, then choose the Downtime Event Deletion report.
Follow the report wizard selections, making sure to choose the proper machine and time period for your report.
You can choose to view your report in HTML, or download the report to your desktop as a PDF or XLS file. You can also share the report with any recipients of your choosing via email – instructions on how to do this can be found in this article.
Amphion
Yes, it is possible to assign your own IP to a black box. Doing so can cause issues with data collection however, and we may need to assist you in this process. Contact us for guidance with this process in order to ensure that data collection continues unhindered.
If you’re using OPCUA the reset process can be done easily through the Customer Portal, from Admin Tools > Machines. Please see this guide for details on restarting a data collection job.
There are a few places where you can find your Amphion’s current firmware version:
- From either the Customer Portal under the Remote Service tab (requires active Remote Service product), or from the Remote Service Platform:1. Go to the Machines tab, and search for the machine or network you’re looking for.
2. Start a remote service session and click the Preview Machine icon .
.
3. Navigate to the Settings tab.
The Amphion model and firmware information is displayed on this page. 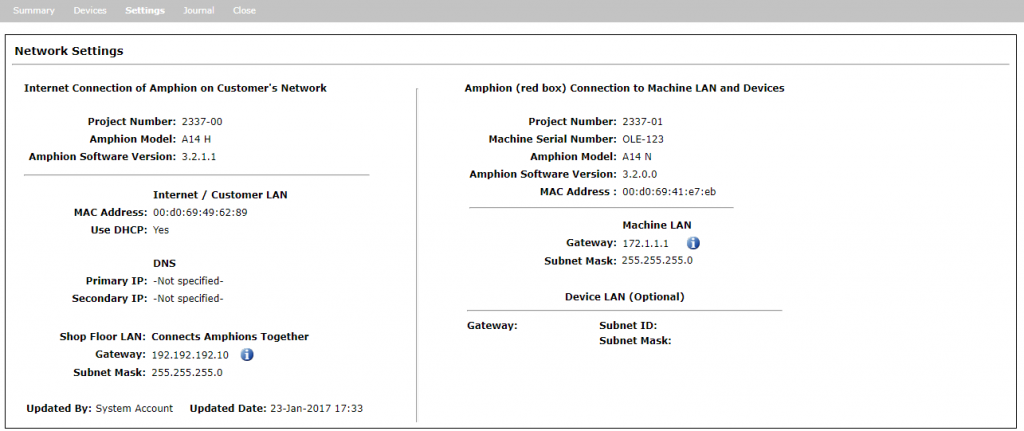
- In the Remote Service platform, go to Network or Machines, and click Edit
 (in the Action column).
The model and software version of the Amphion will be displayed.
You can find the IP addresses of devices connected to Amphions by logging in to the Remote Service Platform.
In the SERVICE application, go to the Machines tab and use the search bar to find the machine you are interested in. Once you locate it, click the Preview Machine icon ![]() . Then, navigate to the Devices tab to view all devices connected to the machine and their IP addresses. Both the Argo IP and the Local IP will be displayed:
. Then, navigate to the Devices tab to view all devices connected to the machine and their IP addresses. Both the Argo IP and the Local IP will be displayed:

Click here to learn more about Argo IP addresses:
https://kb.ei3.com/ufaqs/what-is-the-argo-ip-address/.
Some of ei3‘s Remote Service users may need to reach an FTP server on a machine device during a remote service session.
Any remotely accessible device that runs an FTP server must be configured to use passive mode FTP, with standard TCP ports 3001-3004 used for passive FTP data transfer, in order for a Remote Service user to successfully access it during a remote service session.
The selected TCP ports must also be allowed in the configurations of the Amphions used to create the remote connection to the device. For more information about how to do this see this article.
These requirements must also be met for the case when it is desired to access the FTP server of a machine device from some other device located on the customer’s factory site LAN. For more information about how to set up this case in ei3 for the proper Amphion configurations see this article.
To connect your machines to ei3, it’s important that you have the proper hardware connected to each machine. There are various ways of doing this, using Amphions – while other options exist, such as data boxes or an Amphion black box model, the most common setup involves a green box connected to red boxes which are then connected to your machines. You can read more about each Amphion model in this user guide.
An ideal setup would have each machine hard-wired to an Amphion red box, which in turn, are all connected by network cables to a single green box, which is then connected to the Internet through a modem or router. While it’s possible to set up your Amphions using a WiFi network, we highly suggest that you use a set of network cables and switches to connect your Amphions on the shop floor.
A sample wiring diagram for a factory whose shop floor contains two machines connected to a green box via red boxes might look like this:
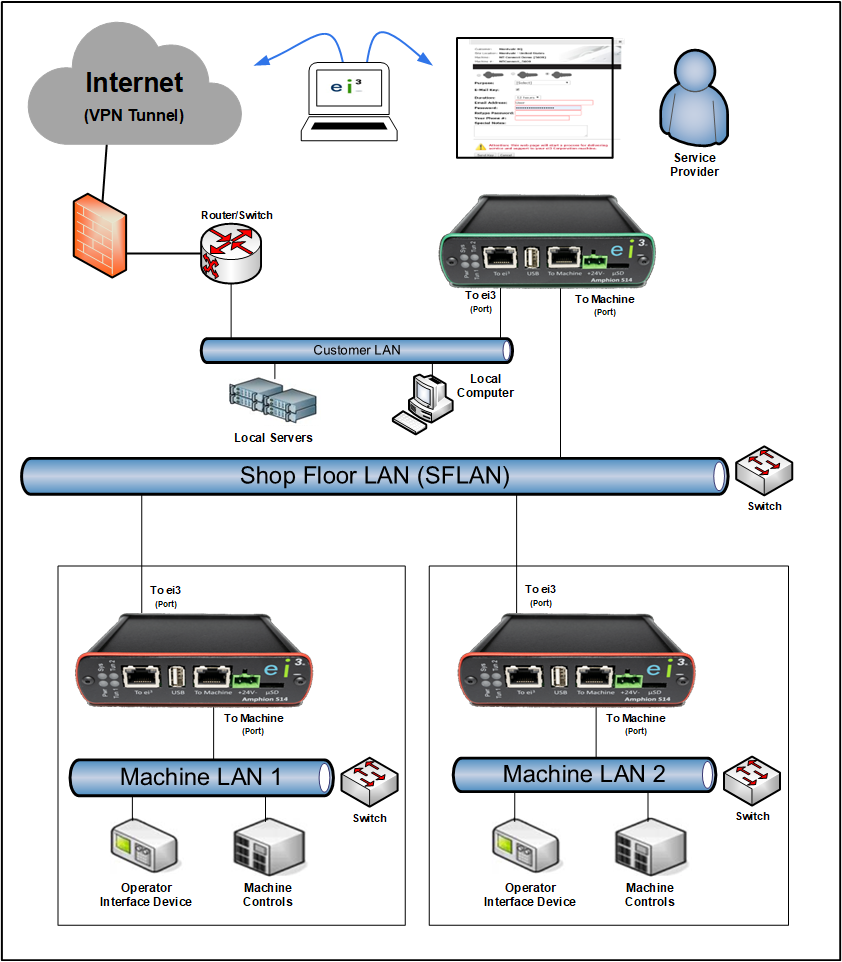
If you have any questions involving your network setup or otherwise getting your machines online, contact us for support.
An ei3 project number is mainly used by ei3 to track each machine separately. This is independent from other tracking information such as an Amphion’s unique serial number, a machine name, or other unique identifiers for a machine.
Each machine-level Amphion redbox S14-N is placed under a network greenbox Amphion S14-H. When you create a network in ei3, a unique project number will be auto-assigned to it. The number scheme will be indicated by a four- or five-digit number followed by a -00 suffix to indicate it as a network-level green box Amphion.
For example, your shop floor’s ei3 project number might be 1234, and the greenbox S14-H Amphion for your plant’s network-level project number would be 1234-00.
Under each greenbox S14-H Amphion, multiple red box Amphion S14-Ns can be added, each connected to one machine per redbox.
To track these redboxes and machines separately, the project number suffix will add upwards staring with -01.
Machine 1 would be assigned the -01 number,
Machine 2 would become -02
etc, etc…
The ei3 redbox S14-N Amphions on your machines at your shop floor would be 1234-01, 1234-02, and so on.
When it comes time to create and apply configuration files for your Amphions, each one can be tracked via its unique project number. The project number serves as a great way to specify which red box (and by extension, machine) is which.
A specific project number and its corresponding configuration file are tied to a certain machine, sure – but if something happens to the Amphion, it can easily be replaced by a new Amphion with the correct configuration for the machine. For this purpose, project numbers are extremely useful!
Keep in mind that while a configuration file for a project number can be changed to new Amphions if need be, other unique tracking information, such as an Amphion’s serial number – cannot be changed.
This article provides useful information and contains answers to many common questions about the use of micro SD cards in the Amphion.
The Amphion S14 Edge Device is capable of using a micro SD card, which, when used, allows the Amphion to cache data while it is collecting. If the Amphion’s internet connection to ei3 that prevent the Amphion from sending its data to ei3, collected data will be stored on the micro SD card until the internet connection is restored. When the connection is restored, the Amphion will send the stored data to ei3 .
Which Amphion models use a micro SD card? – Amphion S14-N red boxes (MRFD) and S14-C black boxes can use micro SD cards for locally caching data collected by the Amphion.
Will the Amphion data collection work without a micro SD card? – Data is collected by the Amphion Edge device with or without a micro SD card. With a micro SD card, data is cached during internet outages.
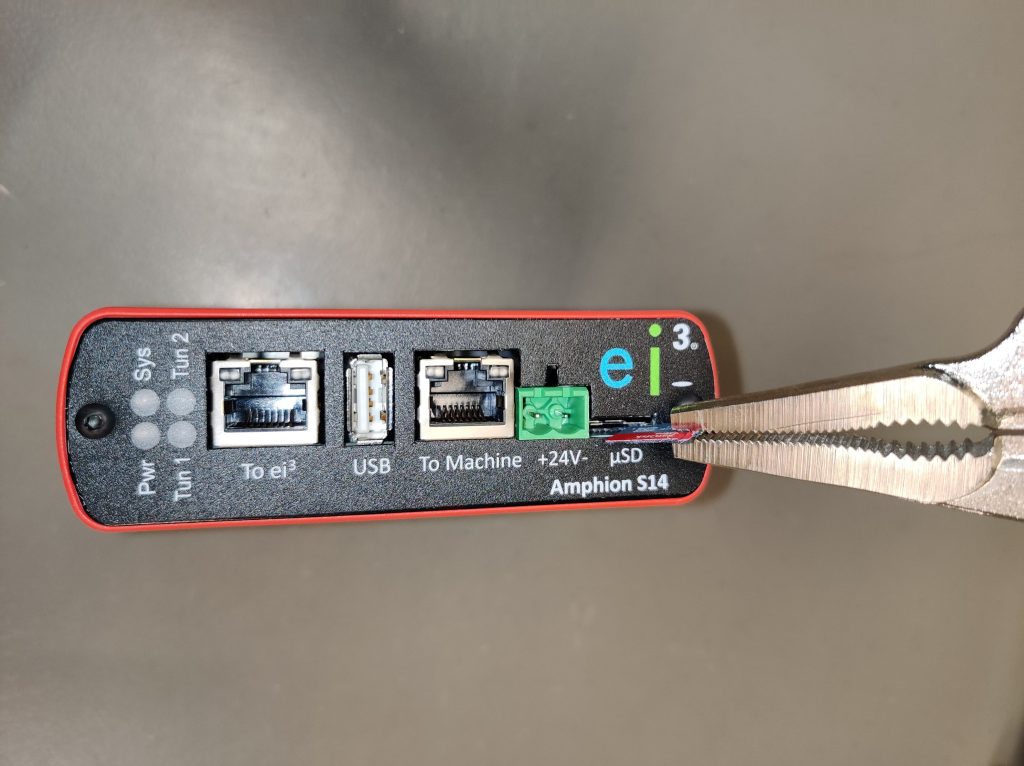
How do I insert or remove the micro SD card? – The card is manually inserted into, or removed from the micro SD card slot through the face of the Amphion. Tweezers can be used to insert or remove the micro SD card; you should hear a ‘click’ as the card locks into place. Be careful not to damage or misplace the card. CAUTION: misplacing the card such that the card does not go into the card slot can result in loss of the card inside the Amphion. Once a micro SD card is inserted, the Amphion will automatically detect its presence and enable it so that it is ready for use.
What file system formats are compatible? (ex. FAT32, NTFS, etc.) – All file system formats for the micro SD card are compatible with the Amphion S14 Edge Device.
Can I remove the SD Card while the Amphion is in use? – Removing a micro SD card while the Amphion is in use is not recommended, because if the card is removed while the Amphion is actively reading or writing data to it, the card can be damaged.
How will I know if the Amphion is correctly using the micro SD card? – As long as the card is inserted correctly and the card is in good condition, it will work correctly. We recommend that you check the card before inserting it to make sure it’s in good condition.
What happens if SD Card is full? How would I know when the SD Card is full? – In the unlikely event that a micro SD card storage capacity is used up, it will continue to operate based on data FIFO (first-in, first-out) rules until it’s able to again connect with ei3. Upon successful connection it will start to transfer files and empty its storage as it does so. The speed of this data transfer and the length of time it will take to transfer all of its stored data depends on the size and quantity of stored data files, the quality and performance of the micro SD card, and the network performance of the Internet connection to ei3.
If you’re concerned about the storage space left on your SD card, contact us and we can assist you.
Is a special Amphion configuration needed for the SD card to work? – In short, no. But if the Amphion is not already properly configured for your machine, data collection as a whole will not work (and the SD card will not be able to cache data for your machine). You can read more about what’s needed before starting data collection in this article.
I see a gap in the data collected on my machine. What can I do to troubleshoot this issue? – This is, of course, assuming you’re collecting data with an Amphion that has an SD card inserted in it, and that everything is working as it should. If data is still being transmitted from SD card, wait until the Remote Monitoring’s Data Snapshot shows a current timestamp. The time for this process to complete may vary depending on the amount of files to catch up, the number of data points your machine is collecting, and your network speed.
We recommend reading this article and following the steps listed there.
Argo IP addresses allow a service technician or an ei3 agent to remotely access a device using a Remote Service session. Argo IP addresses are assigned to each device by ei3 and can only be used for remote connections (they cannot be used locally). An authorized user can connect to any specific device’s Argo IP address through ei3‘s secure VPN.
Click here to learn how to find the Argo IP of a device: https://kb.ei3.com/ufaqs/where-can-i-find-the-ip-address-of-my-amphion-and-its-devices/
API Access
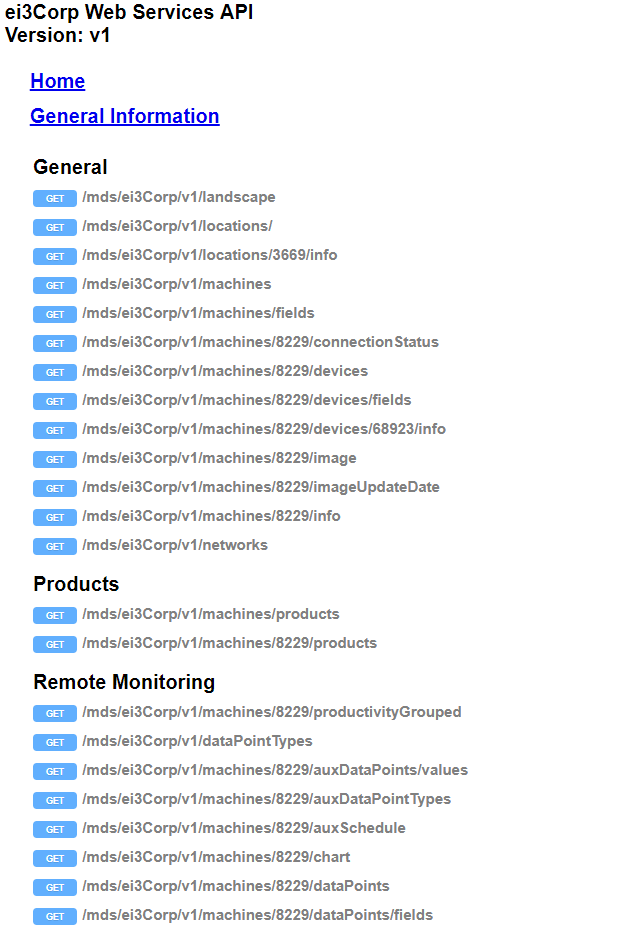
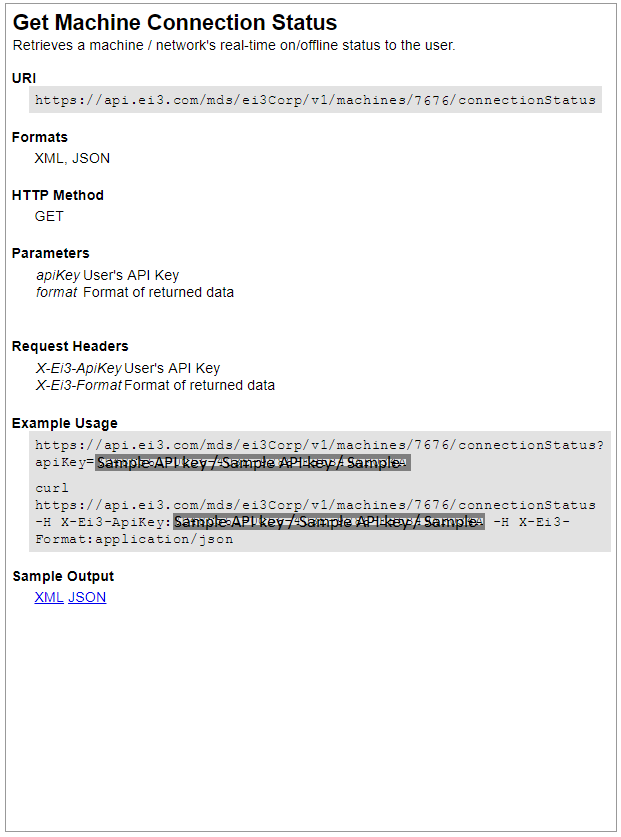
If API Access is enabled for your machine, the API call information can be found in Tools > API Access. Click on the desired function you’d like to obtain an API key for, and check the Example Usage area for sample usage of API calls.
A complete list of API calls available in ei3 can be found here.
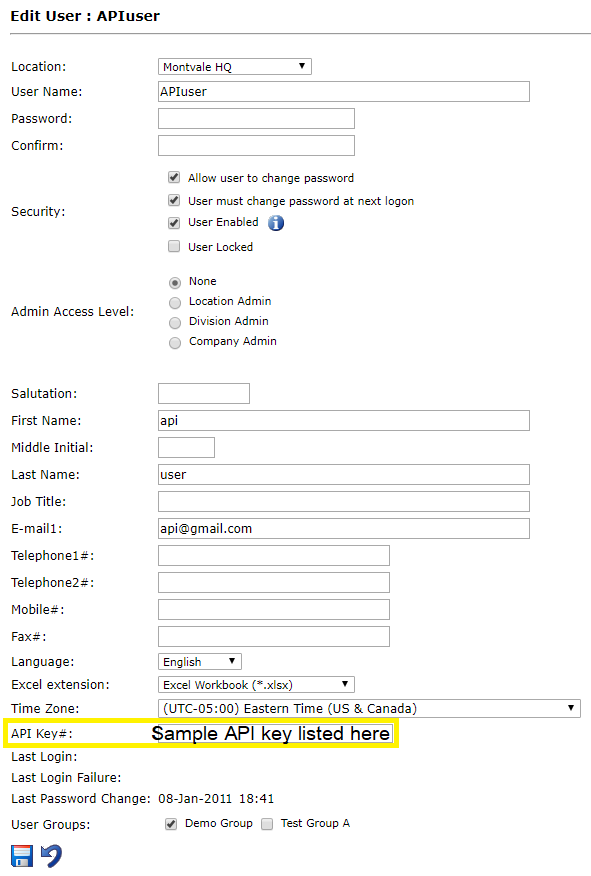
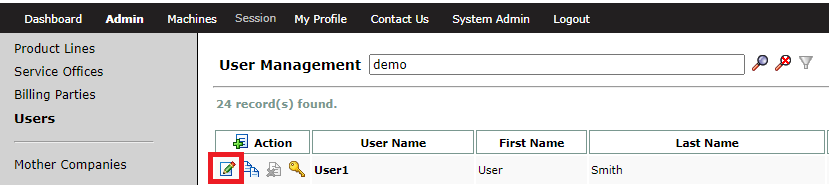
You can find a user’s API key under Admin Tools -> Users. Click the edit ![]() icon in front of a user account. You can find the associated API Key# at the bottom of the user edit page.
icon in front of a user account. You can find the associated API Key# at the bottom of the user edit page.
Similarly, when creating a new user account, you can find the new account’s unique API Key# at the bottom of the user creation page.
API keys are also listed under Tools > API Access. Here, sample API usage for specific API calls are also listed. Read more about it here.
In short, an application programming interface (API) is a particular set of rules and specifications that software programs can follow to communicate with each other. It serves as an interface between different software programs and facilitates their interaction, similar to the way the user interface facilitates interaction between humans and computers.
Practically speaking, this allows for customers to create customized data dashboards and andon displays as needed using ei3’s secure API calling system. Using the ei3’s Customer Portal as an example, a user can create API calls to request specific data (machine speed for example) from ei3’s data collection servers. When the correct ‘key’ is provided (as per a user’s unique API access key) the server ‘unlocks’ the requested information and sends it along to the end user as requested.
A coded API ‘key’ can open a virtual door for the ei3 API to provide allowed information to the end user. It’s actually a long set of numbers and letters that keeps information secure. But anyone with valid ei3 API key can retrieve the information they have permissions for. For convenience, all users can create their own API keys for permitted machines.
Users who create API keys should be aware that their keys will only work as long as their user account is enabled. For a more permanent key, it is possible to create a system key, something that can only be done by administrators.
For more information on API keys and access, see this article.
API (application programming interface) allows websites to grab data from databases and display it in another place, such as another website or an ERP/MES system. This can be used in several ways, publicly or privately. With the right setup, ei3’s API tools allow you to easily display machine information onto displays across your factory floor.
Public-facing API calls are like open doors: an information request comes in, and the requested information goes straight out.
Examples of public-facing API include:
- Map information on websites to display location or directions. ei3 uses Google Maps API to show office locations.
- Microsoft Windows API allows users to develop desktop and server applications that run successfully on all versions of Windows.
APIs can also be set up privately and securely. Instead of providing an open door like in the examples above, an API request may require a ‘key’ in order to obtain access to the requested information. If the key does not match, the API call is denied, and the information does not go through.
ei3 uses a private API to create secure user-specific access for your machine data. ei3 provides its customers unique API keys to use. When a query is made using that specific API key, then that key opens the door.
Any good API has a documentation to provide users information on how to use it, and what functions it can perform. You can see ei3’s documentation on the API page, under the Tools tab. See more information here.
To understand more about API, where to find API keys, and how it can be used on the factory floor to display important machine information, see this article.
Some of ei3’s API calls refer to certain machine productivity status numbers.
The status code numbers refer to the following machine states:
Status code
If the most recent process data in ei3 is current (up to 5 minutes old or less), and the machine’s linespeed is greater than the machine’s set minimum production speed, the API call will set the status value equal to 2 . This signifies that the machine is running / up (at production speed).
If the most recent process data in ei3 is current (up to 5 minutes old or less), and the machine’s linespeed is less than the machine’s set minimum production speed, the API call will set the status value equal to 1. This signifies that the machine is running / up (not at production speed).
In all other cases, the value for this call will set the machine status value equal to 0, signifying that the machine is not running / down.
Data Collection
You will need to reset data collection in order to reconfigure/add datapoints or variables to a data collection job. (This includes changing data points, a read address, tags, etc).
Changing a tag description will not require a data collection restart.
In most cases, you will need to contact us in order to successfully reconfigure/reset a data collection job.
If you’re using OPCUA, it is possible to reset your previous data collection job and restart again with the new data points or tags.
Please refer to this guide for details on restarting a data collection job.
If you’re using a non-OPCUA configuration, please contact us for assistance with reconfiguring or restarting data collection.
From the Customer Portal, go to Remote Monitoring > Snapshot (page should load upon selection).
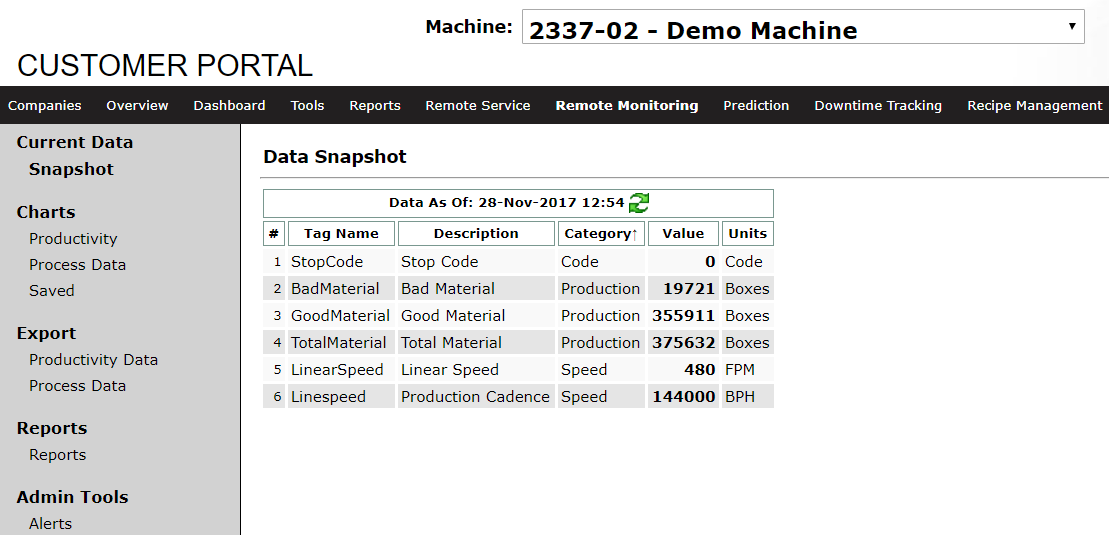
Here a complete list of machine data points is provided, along with the last collected values for each.
At the top of the list a timestamp is displayed showing the last time data was collected successfully.
This is a good way to check if machine data has been collecting successfully, and can be refreshed using the ![]() icon.
icon.
If you’re having issues with data collection, please contact us for assistance.
A gap in data can occur when a machine cannot connect to the internet, so its data cannot get to ei3.
Causes of Data Gaps
Data gaps can occur for a variety of reasons. These can be, but are not limited to:
- The machine or other connected devices are powered off.
- A loss of internet connection or disruption in internet service.
- A firewall or an intrusion detection system that prevents connection to ei3.
- A faulty Ethernet cable or switch.
- The wrong red box is installed on the machine, an unmatched green and red box(es) have been connected, or red boxes have been swapped.
- The wrong IP address or network information configured in the green or the red box.
Checking for Data Gaps
There are a few ways to check if you have a gap in data for a machine.
- Go to the MONITOR > Data Snapshot page. This displays the last time data was successfully collected from the machine.
- From the MONITOR > Reports page, generate a Data Gap Analysis based on your preferences.
- Go to the MONITOR > Alerts page and set up a Data Gap Alert. For information on configuring such an alert, see here.
Verify the Amphion software version
Ensure the machine’s devices are correctly set up
- Rockwell – PLC (MicroLogix, slc505, plc5e)
- Rockwell – PLC (ControlLogix, CompactLogix, FlexLogix)
- Bobst – eWOD (Amphion)
- Generic – JSON (Amphion)
- Generic – XML (Amphion)
- Generic – OPCUA
Verify the machine production units and values
Make sure the Data Points are defined properly in ei3
Make sure you have set a production shift schedule defined and assigned in ei3
You will need to assign a production shift schedule to your machine before you can start the data collection. Without a shift schedule created and applied to the machine, data will not be collected. You can create a machine shift schedule in the Customer Portal, under the Tools menu, under the Schedules tab. After a schedule has been created, you will next need to assign that schedule to your machine from the Manage Schedules page.Check that the data collection is active
In the Customer Portal, from Admin Tools > Machines, click the word INACTIVE under the column titled Collection to start collecting data from the Amphion. You will be prompted with a message to start data collection. It will take a few moments for the system to start data collection on the machine. Once done, the icon symbol should change from INACTIVE to RUNNING. If the machine is offline, the following message will appear:Device is presently off-line but will be provisioned within 15 minutes of coming back on-line.
Once the machine is back online, it will take up to 15 minutes for the collection to start. If the machine is online, it will take 2-3 minutes for the data to appear in ei3 on the Snapshot page in Remote Monitoring. If the device associated with all of the data points has not been set to the required Device Types, you will not be able to click the INACTIVE button. With these steps complete, you’re now ready to start collecting from your machine using the Amphion Edge Device. For more details on data collection, start by reading this article for a general overview.Data Points
To change the data you’re getting from your machine, you will need to configure the data points you’re gathering data from. Some users may have the ability to change these points themselves. See this article for information on changing data points.
If you can’t access these functions or are not sure how to proceed, contact us for assistance with changes to your machine data points.
Downtime Tracking
Your machine may have the Downtime Tracking application enabled, but you may be struggling to get the page to load.
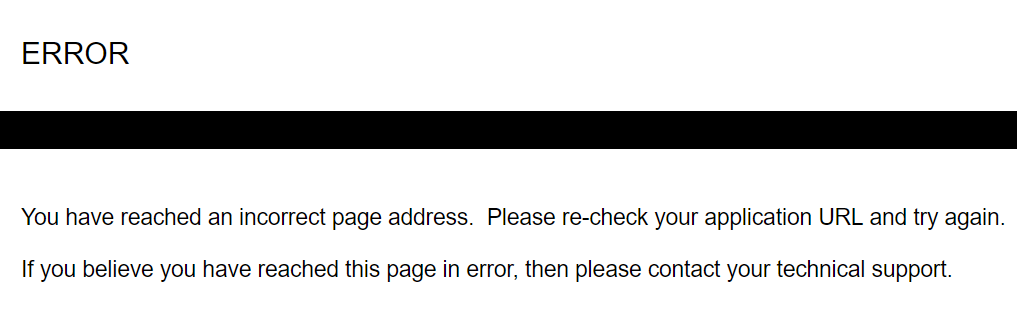
If you’re seeing this error page, try the following steps:
- Log out and log back in again.Sometimes, especially if the page has been open for a long time with no user activity, there may be a session timeout where the user is automatically logged out. Try opening/closing your browser and logging out, then logging back in, or refreshing the web page.
- Set up a shift schedule
Without a shift schedule defined, the Downtime Tracking application will not be able to determine a ‘previous shift’ or ‘current shift’ – crucial aspects of the Downtime Tracking process. If a shift schedule is not defined the page will not be able to properly display its contents. Once a shift schedule has been created and applied to the machine, the Downtime Tracking application should work normally.For details on setting up and applying a shift schedule to a machine, see:
Creating a shift schedule
Applying a shift schedule to a machine - Sometimes a user may have access to machines at multiple locations – some machines with downtime tracking and some without. The user will see Downtime Tracking as a menu item, but if they click on it while accessing a machine without downtime enabled it will produce an error message. To fix this, the user must go to the Dashboard tab and select a machine with downtime tracking configured, then navigate back to the Downtime Tracking application in order to view it normally.
ei3’s Downtime Tracking allows admin users to change downtime periods on any machine to be listed instead as uptime (run time). Doing this ‘deletes’ a downtime period and instead treats it as machine runtime when calculating machine OEE. Whenever a change like this is made, ei3 keeps a historical record of it for reference. It is possible to get a list of all changes of this nature in a report that you can refer to at any time.
In the Customer Portal, select Reports, then choose the Downtime Event Deletion report.
Follow the report wizard selections, making sure to choose the proper machine and time period for your report.
You can choose to view your report in HTML, or download the report to your desktop as a PDF or XLS file. You can also share the report with any recipients of your choosing via email – instructions on how to do this can be found in this article.
General
Several search results list tables in the system, including the Users/User Groups, or Machine Data Points, will load a page with an empty table of search results displayed by default.
Most tables with a list of search results can be searched by any column (i.e. Name, Location, Description, Enabled, etc) to display those items.
To show all search results, enter * in the search bar.
If you’re still having issues seeing data, contact us.
A manufacturing execution system (MES) is any computerized system used to track the process of raw materials to a final product. These systems range in variety, purpose, and functionality, and can be used to track anything from product waste, OEE, scheduling and resource management, product life cycles, and more.
Enterprise resource planning (ERP) refers to any business management software which are used to collect, store, share, or otherwise better understand data from business-related activities. In many cases, ERP systems will display optimal and relevant information for machines, efficiency, and job information.
The most important function of an ERP or MES system is how it enables visual data analysis in real time, and provides effective diagnostics, which can lead to process improvement over time.
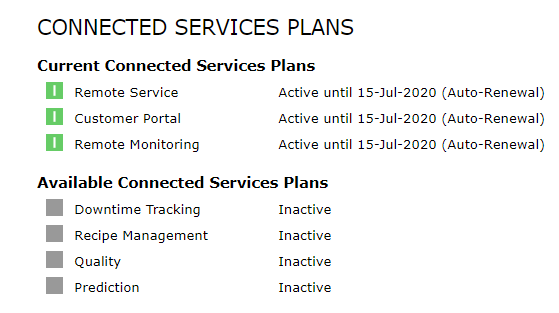
Across ei3’s web applications and products, both in the Remote Service Platform and the Customer Portal, the red ![]() and green
and green ![]() status icons are used to indicate the current status of various items.
status icons are used to indicate the current status of various items.
In general, these status symbols follow the following rules:
- A red
 status symbol means off, disabled, or inactive.
 - A green
 status symbol means on, enabled, or active.
 - In some cases, a grey status icon
 may appear – this can either mean inactive, invalid, or null.
Status icons are important on web pages such as the Remote Service page, which displays a list of your factory’s machines and their current status.

The status indicator lights in the various columns have slightly different meanings.
Remote Service – Contract Status
![]() – Remote Service is active on this machine.
– Remote Service is active on this machine.
![]() – Remote Service is not active.
– Remote Service is not active.
![]() – The machine’s Remote Service contract is expiring in the next 90 days.
– The machine’s Remote Service contract is expiring in the next 90 days.
![]() – Remote Service has never been active on this machine.
– Remote Service has never been active on this machine.
Hovering your mouse over any of these icons will show the expiration date of the Remote Service application. If it has already expired, the hover text will show the date it expired.
If Auto-Renew has been selected for any of these products, the hover-over information will also display the end date of the current product activation – it will also indicate whether the auto-renewal is active in parentheses after the end date of the current active period.
![]()
Network Status
![]() – The network is online and connected. The green box is accessible (pingable) and currently transmitting data to ei3.
– The network is online and connected. The green box is accessible (pingable) and currently transmitting data to ei3.
![]() – The network is offline and not accessible. This means that all red boxes on the network are also not accessible at this time.
– The network is offline and not accessible. This means that all red boxes on the network are also not accessible at this time.
Mousing over an icon will show how long the network connection status has been in its current state (Connection OK or Connection Failed).
![]()
Machine Status
![]() – The red box on the machine is online and accessible.
– The red box on the machine is online and accessible.
![]() – The red box on the machine is not accessible at this time. Common causes for this include an offline green box, or a faulty cable connection to the box.
– The red box on the machine is not accessible at this time. Common causes for this include an offline green box, or a faulty cable connection to the box.
Mousing over an icon will show how long the connection status to the red box has been in its current state (Connection OK or Connection Failed).
![]()
Devices
Clicking in to Preview Machine using the ![]() icon allows a user to view the individual machine devices (from the Devices page).
icon allows a user to view the individual machine devices (from the Devices page).
The top of the page displays whether the network or machine are accessible (matches the statuses shown from the main Remote Service page).
Each device on the machine is listed, with a status icon ![]() or
or ![]() to indicate if the device is accessible.
to indicate if the device is accessible.
Auto-Renew
Auto-Renewal of products on machines from the Product Activations page will allow a product to automatically be renewed once the current activation period has ended. Certain web pages, such as the Machines tab in the Remote Service Platform, or the Dashboard in the Customer Portal, will display the product’s current end date with an “Auto-Renewal” message following in parentheses, indicating that auto-renewal is active for that product.
It is recommended to use a recent version of one of the following browsers with ei3:
- Google Chrome;
- Mozilla Firefox;
- Microsoft Edge.
If you are trying to use another browser, contact care@ei3.com to check your browser compatibility with our web applications.
See also: Minimum system requirements for ei3
Using the ei3’s VPN remote service software and other web applications such as the Customer Portal and its associated apps (e.g. PRODUCTION, DOWNTIME or RECIPE) requires that the client computer have at least the following characteristics:
- Windows 10 or higher
- 1 gigahertz (GHz) or faster processor
- 1 gigabyte (GB) RAM (32-bit) or 2 GB RAM (64-bit)
- 300 MB of free disk space
- Attached graphics display capable of 1024 by 768 resolution.
- High-speed Internet connection (broadband or better)
See also: Web browsers supported by ei3
How to
Every machine that has productivity enabled is tracked for OEE and downtime. Machine OEE is calculated automatically by algorithms that evaluate availability, production rates, and quality. This productivity information can be automatically compiled into a report that is sent to a list of email addresses.
The reports are already configured to be presented to your shop floor team. They can be printed and placed on your Lean Information Visual board by the entrance or put up on a big screen for your end of shift review meeting. More information about the available reports can be viewed here.
Configuring reports for automated delivery by email is a part of ei3‘s standard report configuration tool. You can learn how to set that up in detail here.
- Choose the report you want to use
- Configure the report for your machine
- Schedule the report to be delivered to your team members
Now you have a beautiful report ready to be displayed on your Lean board.
Contact us at care@ei3.com if you need help or assistance setting up this report.
Sometimes just knowing if a machine is running or not can make the difference between a good or bad day. You probably don’t want lots of messages – but a simple automatic text telling you when a machine is stopped can be a big help. Here’s how to do that.
Every machine has one data point that is defined as an indicator of productivity. If that point is below a threshold then the machine is considered to be “down”. ei3 analytics process that point automatically to decide if the machine is up or down and when it’s down, there’s a downtime clock that keeps track of how long it’s been down.
An alert can be configured to go off when the amount of this down time reaches a limit – in fact many alerts can be created to alert ever-higher people on your team as the amount of down time increases. To set up these alerts you need to have site administrator permission level in ei3. If you are not a site admin, then please ask your site admin to do this for you:
- Create a new alert for your machine
- Set the alert to be a “Downtime Alert”, it’s a special type of alert.
- Decide who gets it
- Create a schedule for when the alert is active
- Test your alert
Now you have a working downtime alert. Multiple alerts can be made for the same downtime, and you can create an escalation strategy that would use these alerts to bring different people into the loop as the downtime gets longer and longer.
Machine operators need to see what’s going on. And their needs might change depending on what product, recipe or operation they are working on. How to display information in a way that meets this complex need?
The ei3 Data Dashboard is a flexible tool that you can use to set up a custom board without any programming. It uses a drag and drop method that everyone can use – no code required!
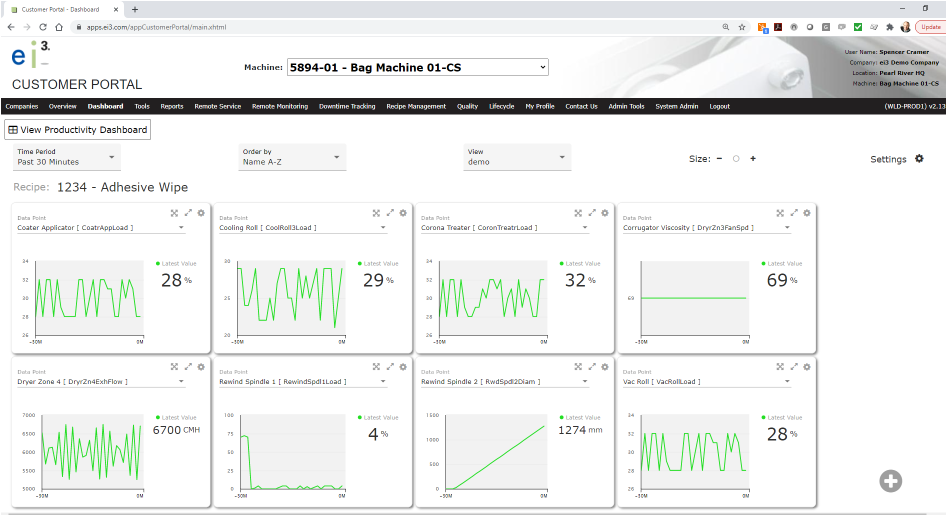
Here’s how to set this up for your machine:
- Navigate to the “Dashboard Tab” on your portal
- Pick a group of points
- Give it a name
- Come back to it again in the future
The first step towards reducing machine downtime is to have an automatic capture of machine downtime with an operator-assisted method to assign the reasons. This might seem like a complicated requirement but with ei3 it’s already set up and waiting to go.
First you need to define codes and categories. Getting this set up can take some effort but that effort pays great dividends in the short term.
- Set up downtime codes and categories
- Add visual icons
- Assign the downtime reasons to your machine
- Train your operator teams to use a visual assignment tool
When the downtime codes are routinely entered, it becomes progressively more clear which reasons can be reduced or controlled. With this information it’s easier to plan improvement projects and measure their ROIs.
This article provides details about how an ei3 admin should configure data points and data tags on a machine for use with the SUSTAIN badges available in dashboards that are displayed on the INSIGHTS Overview page in ei3. To learn more about the SUSTAIN badges, please see the article INSIGHTS – Overview Page: SUSTAIN Badges.
The SUSTAIN badge will only be available for machines that have active subscriptions for the SUSTAIN application. Additionally, several data points must be correctly defined on the machine. This article explains how to do so.
Required Data Points
The following data points are required in order for the SUSTAIN badge to show total production and energy consumption, as well as to calculate the carbon emissions.
- Tag Type: Production material total count delta
Value: Material produced (delta)
Units: Machine “units of production” - Tag Type: Power Active Positive Delta
Value: Electrical energy consumed (delta)
Note: This is sometimes referred to as “Active” energy, and if so, should be the positive component only.
Units: Wh, kWh, or MWh
Optional Data Points
The following data points are optional, and should be used only if there is a pneumatic or other system on the machine that is both consuming energy, and the energy consumption is measured and collected by ei3.
- Tag Type: Pneumatic Energy Total Delta
Value: Energy consumed by pneumatic system (delta)
Units: Wh, kWh, or MWh - Tag Type: Other Energy 1 Delta
Value: Energy consumed by other system 1 (delta)
Units: Wh, kWh, or MWh - Tag Type: Other Energy 2 Delta
Value: Energy consumed by other system 2 (delta)
Units: Wh, kWh, or MWh - Tag Type: Other Energy 3 Delta
Value: Energy consumed by other system 3 (delta)
Units: Wh, kWh, or MWh
Machines
You may need to create or assign downtime codes. Typically, you will need to start by creating downtime categories and codes, then managing and assigning codes to individual machines.
You can change specific machine information from the Admin Tools page. Click here for more information.
You can change specific machine information from the Admin Tools page. Click here for more information.
Any machine stop will normally trigger a downtime event. Those downtime events that are not either manually or automatically assigned to a downtime code will be considered an unassigned downtime event and will negatively impact the machine’s availability.
A machine is considered Stopped (or down) when its speed falls below its set Minimum Production Speed. This terminology is irrespective of downtime tracking or downtime events.
You can change specific machine information from the Admin Tools page. Click here for more information.
You can check your machine connection status from the Remote Service > Machines page in the Customer Portal, or from the Machines page in the Remote Service Platform.
The status box indicators will show whether the machine is currently on or offline, and mousing over a box will display the duration of the current status.
When setting up a machine shift schedule, an option provided is the Day Start Offset. This is used in cases where a shift might start the day before on the first day of the week (in a shift schedule configured to start on Mondays, a 6-hour shift starting at 23:00 on Sunday night and stretching to 05:00 of the next day would use the day start offset).
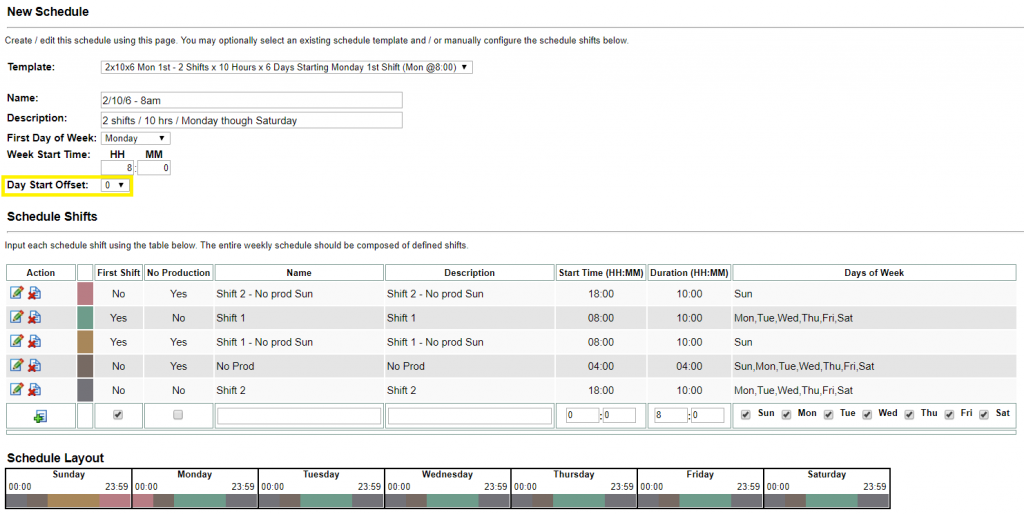
Day offset = 0 is the standard and used for most schedules. Its used when the first shift of the day is the same day as the first day of the week. An example would be first shift starting at 7:00 on Monday.
Day offset = -1 when the first shift of the week falls outside of the first day of the week. This is used for schedules where the customer works Monday to Friday, but the first shift of the week occurs at 23:00 Sunday night. This tells the system to look back at the previous day to grab the first shift of the week.
An ei3 project number is mainly used by ei3 to track each machine separately. This is independent from other tracking information such as an Amphion’s unique serial number, a machine name, or other unique identifiers for a machine.
Each machine-level Amphion redbox S14-N is placed under a network greenbox Amphion S14-H. When you create a network in ei3, a unique project number will be auto-assigned to it. The number scheme will be indicated by a four- or five-digit number followed by a -00 suffix to indicate it as a network-level green box Amphion.
For example, your shop floor’s ei3 project number might be 1234, and the greenbox S14-H Amphion for your plant’s network-level project number would be 1234-00.
Under each greenbox S14-H Amphion, multiple red box Amphion S14-Ns can be added, each connected to one machine per redbox.
To track these redboxes and machines separately, the project number suffix will add upwards staring with -01.
Machine 1 would be assigned the -01 number,
Machine 2 would become -02
etc, etc…
The ei3 redbox S14-N Amphions on your machines at your shop floor would be 1234-01, 1234-02, and so on.
When it comes time to create and apply configuration files for your Amphions, each one can be tracked via its unique project number. The project number serves as a great way to specify which red box (and by extension, machine) is which.
A specific project number and its corresponding configuration file are tied to a certain machine, sure – but if something happens to the Amphion, it can easily be replaced by a new Amphion with the correct configuration for the machine. For this purpose, project numbers are extremely useful!
Keep in mind that while a configuration file for a project number can be changed to new Amphions if need be, other unique tracking information, such as an Amphion’s serial number – cannot be changed.
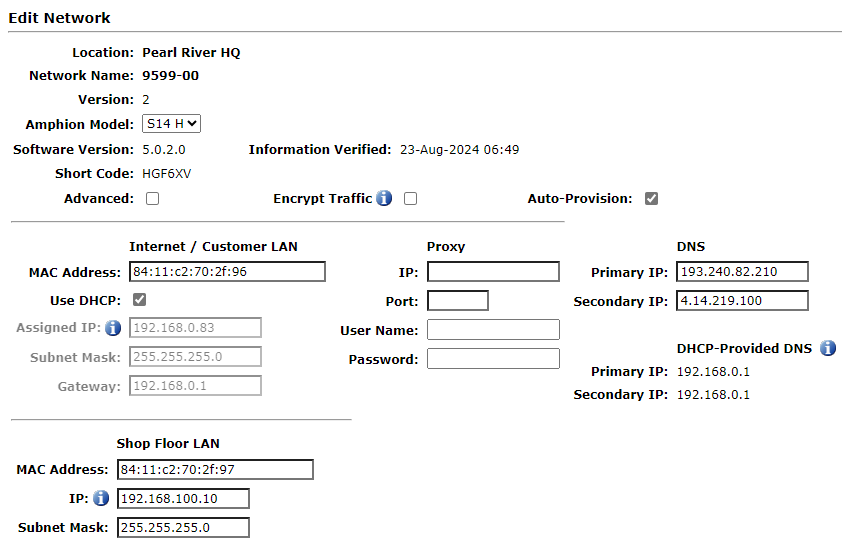
Networks
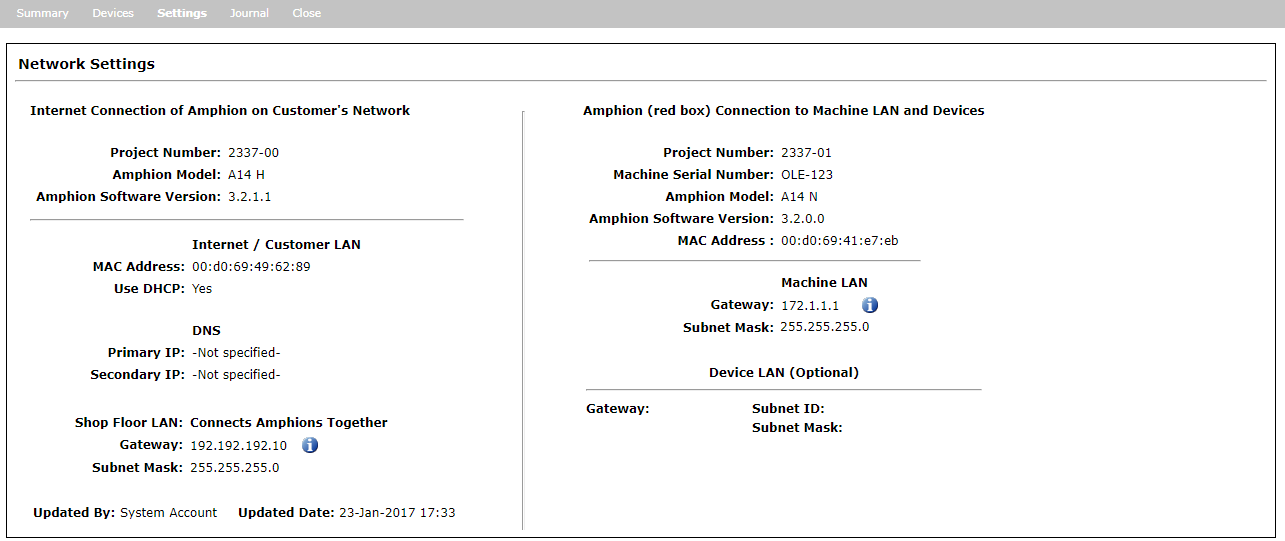
There are two ways to find the network information for your Shop Floor LAN:
- From either the Customer Portal under the Remote Service tab (requires active Remote Service product), or from the SERVICE application:
1. Go to the Machines tab, and search for the machine or network you’re looking for.
2. Click the Preview Machine icon.
3. Navigate to the Settings tab.
Network information will be displayed on this page. - From the SERVICE application:
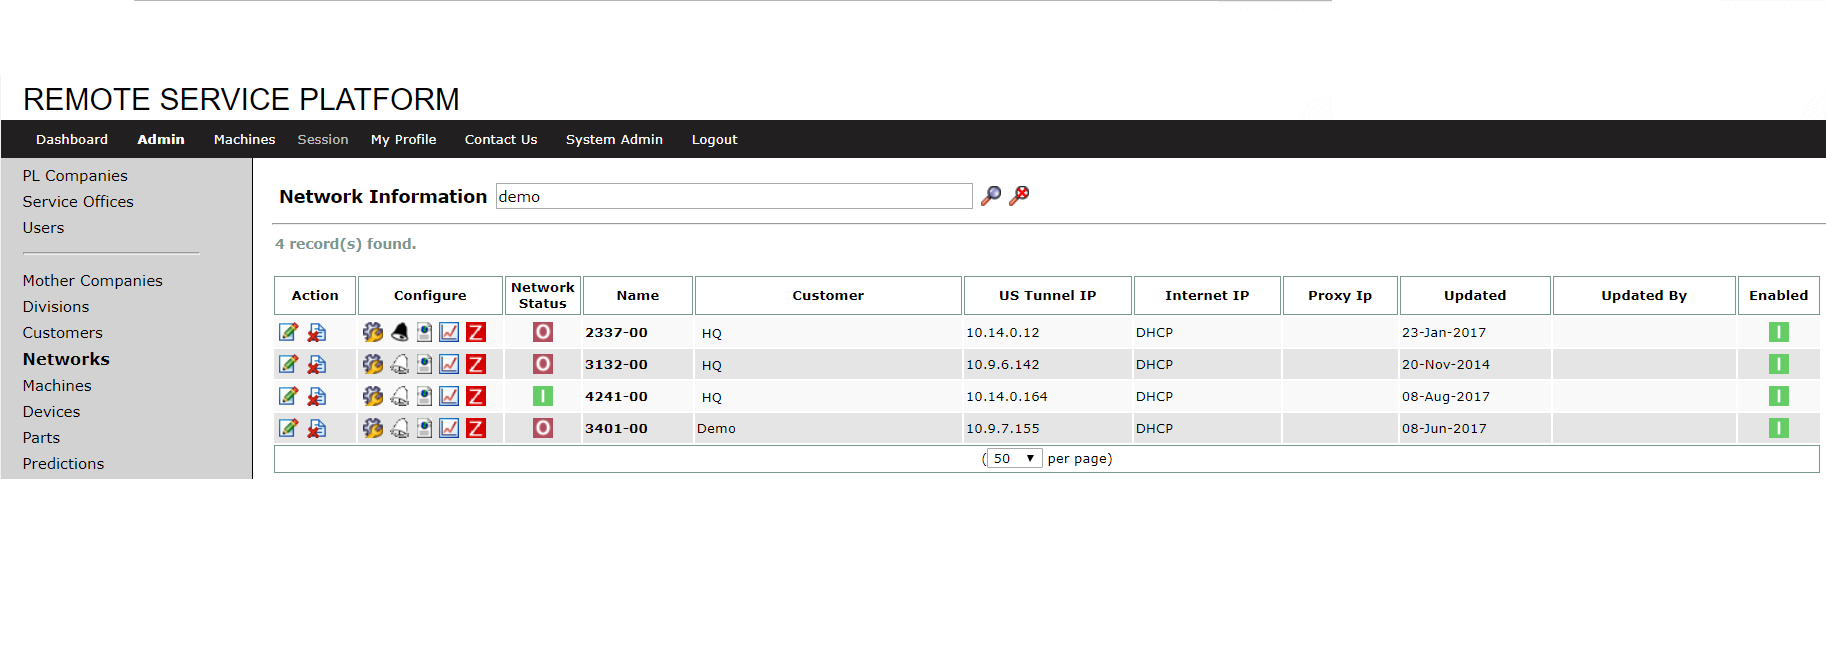
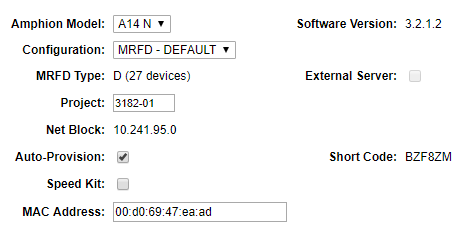
1. Go to Admin > Networks.
2. Search for the desired network.
3. Click Edit (in the Actions column).
Network information will be displayed on this page – see the sample screenshot below.
Modern firewalls are capable of doing inspection of the packet contents for portions of https traffic flow. This ability falls into the category of Intrusion Detection or Intrusion Prevention (IDS/IPS) services. This can be important when a Green or Black box Amphion fails to make a connection with its VPN servers and is an unintended consequence of these advanced firewall capabilities. Following is a brief explanation of what happens and how to make a change to the firewall rules to allow the connection.
Our devices use the well known open-VPN protocol over https/SSL (secure web-browsing) to connect to our servers. Since the connection set up for an SSL connection exchanges cipher suite and SSL certificate information in clear-text, an advanced firewall can examine this stream of data. Depending on the content in the firewall IDS/IPS ruleset, the firewall might erroneously decide that the traffic between the Amphion and its VPN servers is flawed and thus interrupts the connection. By doing so, the Remote Service VPN is never established.
The fix for this is simple. The address of the Amphion needs to be added to the firewall’s white-list of exceptions for IDS/IPS inspection. By doing this, the traffic from the Amphion to its VPN servers will not be blocked and the VPNs can be established.
You can find the IP addresses of devices connected to Amphions by logging in to the Remote Service Platform.
In the SERVICE application, go to the Machines tab and use the search bar to find the machine you are interested in. Once you locate it, click the Preview Machine icon ![]() . Then, navigate to the Devices tab to view all devices connected to the machine and their IP addresses. Both the Argo IP and the Local IP will be displayed:
. Then, navigate to the Devices tab to view all devices connected to the machine and their IP addresses. Both the Argo IP and the Local IP will be displayed:
Click here to learn more about Argo IP addresses:
https://kb.ei3.com/ufaqs/what-is-the-argo-ip-address/.
Argo IP addresses allow a service technician or an ei3 agent to remotely access a device using a Remote Service session. Argo IP addresses are assigned to each device by ei3 and can only be used for remote connections (they cannot be used locally). An authorized user can connect to any specific device’s Argo IP address through ei3‘s secure VPN.
Click here to learn how to find the Argo IP of a device: https://kb.ei3.com/ufaqs/where-can-i-find-the-ip-address-of-my-amphion-and-its-devices/
Performance & Downtime
A Performance value above 100% occurs when the calculated average speed of the machine is above the maximum speed entered in the machine data page.
If the maximum speed is correct, check to make sure that the average speed being calculated by the system is correct. The average speed is computed by dividing the total units of production by the Machine Operating Time (MO) of the machine.
(Average Speed = Total Units/MO)
Whenever the machine is in a down state, a downtime event is automatically created in the system. Further, if a downtime code is assigned to the period, whether manually or automatically, the “type” of downtime code that is assigned can influence the calculation of OEE for that period of time.
- If the resulting downtime period is not assigned, it is categorized as “Unassigned”, it is treated as Unplanned Downtime, and the Machine Operating Time is reduced, causing Availability to be reduced.
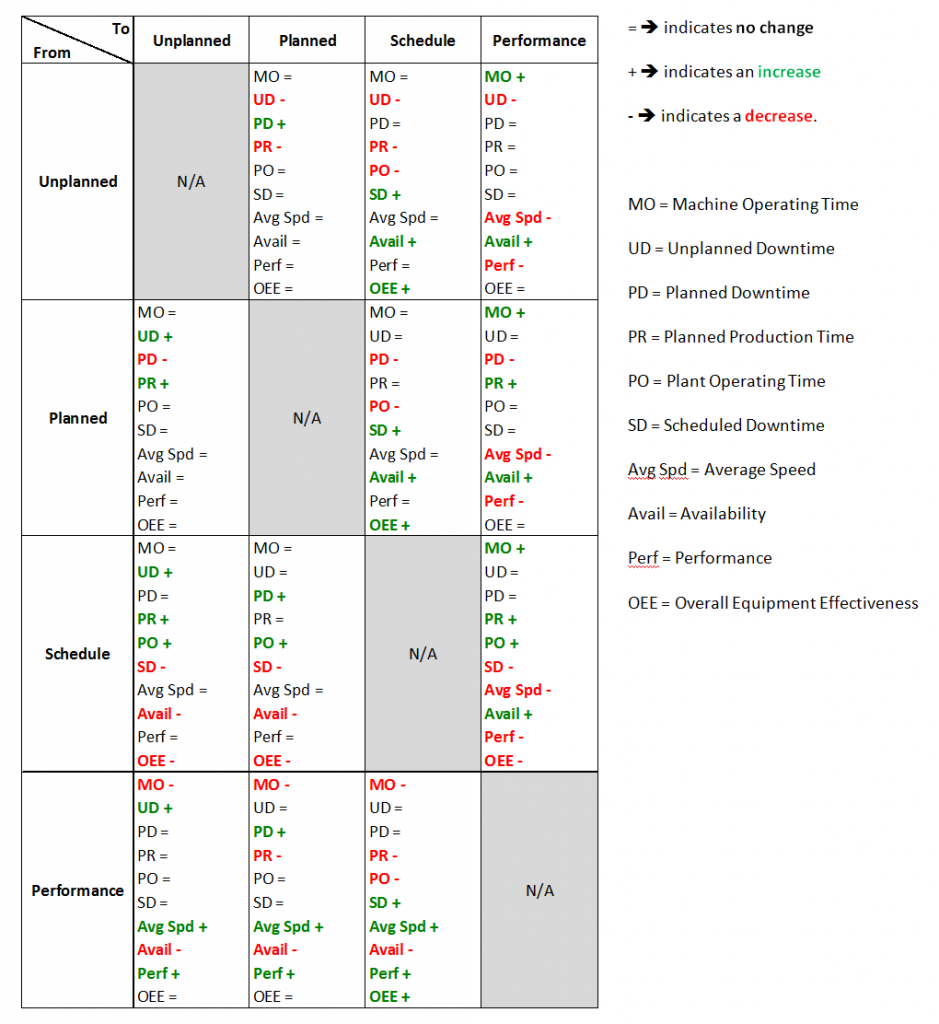
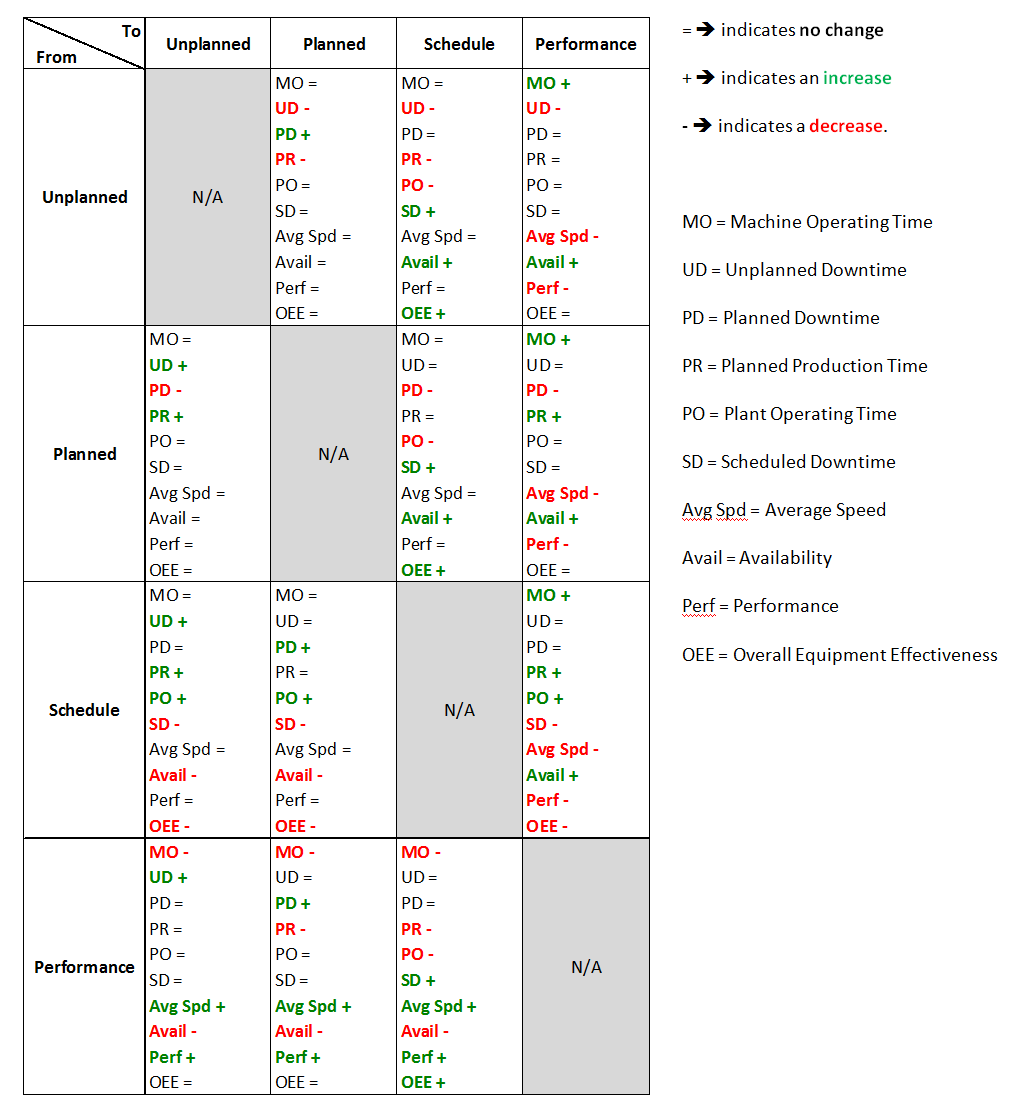
- If the resulting downtime period is assigned with a downtime type of “Scheduled”, then it is defined as Scheduled Downtime, and both the Machine Operating Time and Plant Operating Time are reduced by the amount of time of the downtime period. This is consistent with OEE industry standards, in which Scheduled Downtime is not considered in the evaluation of OEE. If the downtime type is changed to “Scheduled” by manual re-assignment from any other type, then OEE components are affected accordingly. Please refer to the Downtime Transition Matrix below.
- If the resulting downtime period is assigned with a downtime type of “Planned”, it is defined as Planned Downtime, and both the Machine Operating Time and Planned Production Time are reduced by the amount of time of the downtime period. In the cases when the downtime type for this period was previously either unassigned or assigned as the “Unplanned” type, then Machine Operating Time and Availability remain unchanged because the downtime is still considered an Availability Loss. If the downtime type is changed to “Planned” by manual re-assignment from either “Scheduled” or “Performance”, then OEE components are affected accordingly. Please refer to the Downtime Transition Matrix below.
- If the resulting downtime period is categorized with a downtime type of “Performance”, then it is defined as Performance Loss, and the machine’s Average Speed is reduced causing the Performance component of OEE to be reduced. If this assignment was for a period that was previously assigned to a different type, or unassigned, then the Machine Operating Time would be increased by the same amount of time, and OEE components are affected according accordingly. . Please refer to the Downtime Transition Matrix below.
- If the resulting downtime period is assigned with a downtime type of “Unplanned”, then it is defined as Unplanned Downtime, and the Machine Operating Time is reduced causing Availability to be reduced. In the cases when the downtime type for this period was either previously unassigned or assigned as the “Planned” downtime type, then the Machine Operating Time and Availability remain unchanged because the downtime period is still considered an Availability Loss. If the Downtime Type is changed to “Unplanned” by manual re-assignment from either “Scheduled” or “Performance”, then OEE components are affected accordingly.
The maximum duration of a continuous downtime event is 30 days. ei3 will automatically end a downtime event when its duration reaches 30 days, and then begin a new downtime event.
Machine downtimes are evaluated by the ei3 servers once every five (5) minutes. During each evaluation, the state of the machine is determined for each of the preceding data collection intervals.
- A machine is determined to be down whenever its speed falls below Minimum Production Speed. A machine is determined to be running whenever its speed is at or above Minimum Production Speed.
- A new downtime event is created whenever one of the following transitional states is detected:
- A machine transitions from running to down without a machine downtime code observed. The downtime event created will be of type “Unplanned”.
- A machine transitions from running to down with a machine downtime code observed. The downtime event created will be defined by the downtime code observed.
- A machine remains down but with a different downtime code observed. The downtime event created will be defined by the new code observed.
- A machine remains down and enters a No Production Shift or a machine transitions from running to down during a No Production Shift. The downtime event created will be of type “Scheduled”. Note: Any observed machine downtime code will be disregarded and the machine schedule will override the machine’s downtime code.
- A machine remains down and exits a No Production Shift. The downtime event created will be of type “Unplanned”.
- Any downtime event is ended whenever one of the following transitional states is detected:
- A machine transitions from down to running.
- A machine remains down but provides a different downtime code.
- A machine remains down and either enters or exits a No Production Shift.
Note: If a downtime event starts as type “Unassigned” for some period of time, and then a specific machine downtime code (i.e. “XYZ”) is observed, then the prior period of the “Unassigned” downtime will be assigned the code “XYZ”. In addition, if a downtime code is assigned by a user during the period the machine is down, that assignment will be applied to the entire downtime event.
Machine waste is calculated by three main factors: Good Material, Bad Material, and Total Material.
Total Material is a measure of all (total) material produced by the machine.
Good Material is calculated by summing the machine’s good material output – the material that is deemed to have acceptable quality.
Bad Material can be determined by subtracting the Good Material from the Total Material for a discrete time period. This is the amount of waste (Bad) material that has been produced by the machine.
In order to best calculate these values, we may rely on sensors placed strategically along the machine material flow to count the material produced. For certain machine types where the machine’s control system automatically discards waste material, counting the material input and output separately is sometimes used to determine waste, such that waste then becomes the difference between input and output material.
Such a machine with well-placed material count sensors allows for a reasonable computation of OEE and waste material produced by the machine.
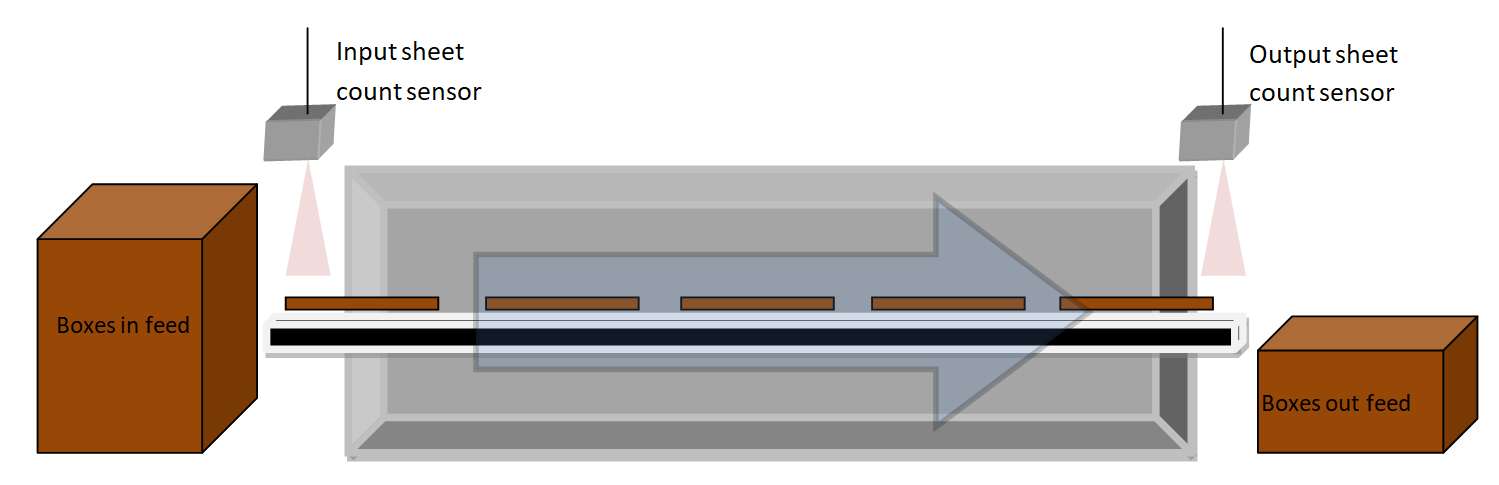
Waste = input – output
In order to collect the data, we need only two of the three measurements: the third can be derived from the other two.
Here are four common scenarios:
- Only total material is counted – there is no Good/Bad Material count, and hence, Quality cannot be derived from the machine data.
- Both Total & Good Material are counted – Bad Material equals Total – Good Material.
- Total & Bad Material are counted – Good Material is equal to Total – Bad Material.
- Good Material and Bad Material are both counted – then Total Material is equal to their sum.
By definition, OEE is based around total material output from a given machine. While OEE calculations can be set up to be unique per machine, anything which is not set to the standard for OEE calculations can cause trouble – ei3 does not recommend doing so.
Doing so can create rare occurrences where the good material value can be higher than total material value when examining the minute by minute raw data from the machine using the data export tool. This usually occurs with the data at the beginning of a shift/day, job run, or after a downtime event where material from the previous event hasn’t fully made its way through the equipment. When this happens, the system uses the OEE standard of machine output on all calculations used in ei3.
Minimum Production Speed is the minimum speed at which the machine is considered to be running in production operation; for most machines it should be set to 1 unit rate of production. This parameter is defined to provide some customers with a method to represent actual machine status for specific machines in a way that is customary to them. For example, it is used for certain types of machines where warm up / start up or cool down / shut down times are significant and not considered to be making production quality material. It is also used for certain types of machines that frequently experience micro-stops, to define when the downtime condition instantaneously measured during a micro-stop should be considered as Uptime.
A Minimum Production Speed is needed to evaluate the machine’s performance in a consistent way in all circumstances, especially with regard to calculations concerning production. It is necessary to insure that in order for the machine to be considered running / producing, a reasonable amount of material is produced per unit of time. The Minimum Production Speed is also used in verification of machine status during rare instances when there is missing data during the period the machine is in operation.
Example: If a machine is capable of producing 300 units per minute, yet only produces 1 unit in a given minute, then it may be appropriate to consider the machine as not “actually producing” during the entire minute because the quantity produced is not a meaningful indicator of normal or abnormal production. See the following for explanation of the logic here.
Some continuous-fed machines require a slower starting process before reaching a true “production speed”. This can include “threading” or other similar preparation / make-ready activities which, although they can result in some small number of units being produced, may be inappropriate to be included in productivity calculations. Setting the Minimum Production Speed higher allows this time and production to be ignored.
See more information here: How does Minimum Production Speed impact OEE calculations?
How does Minimum Production Speed impact OEE calculations?
Minimum Production Speed can impact the Availability component of OEE.
- When the machine speed is equal to or above the Minimum Production Speed, and making production material, the machine is determined to be running and the time is considered Machine Operating Time.
- When the machine speed is below the Minimum Production Speed, then the machine is determined to be down. By default, this time is treated as Unplanned Downtime even if it is producing material.
- What is the impact of setting Minimum Production Speed = 1
When the Minimum Production Speed is set to 1, then any material (whatsoever) produced per unit of time, will cause the machine to be considered running during that time. This is the most common condition for typical machines, and it is consistent with the most common interpretation of Machine Operating Time, in which the machine is considered to be running if it is making any production quality material.
- What is the impact of setting Minimum Production Speed > 1
In most cases, the Minimum Production Speed should be set to 1 unit rate of production. In special cases where there are more frequent micro-stops or a machine has very slow start-up speeds, it could be set greater than 1 such that, during those periods, the machines are not considered to be both running and making production material. However, if this parameter is set too high, then what may be considered a normal amount of micro-stops within a single unit of monitoring time can theoretically result in the machine being considered down for that entire period of time. It is better to set this parameter to a low enough value so that only an excessive amount of Micro-Stops that occur during typical machine use will be treated as downtime.
Micro-stops are minor stoppage losses that occur when a machine stops for a short time as a result of a temporary problem. As soon as someone such as an operator resolves the problem, the machine quickly returns to normal operation. When a minor stoppage can be dealt with quickly, i.e., as soon as it is noticed, it is often considered a “micro-stop”. Since micro-stops can still interrupt workflow and temporarily cease the production of material, they may be categorized as downtime. However, in some cases, and in accordance with OEE standards, it may be more accurate to represent an “expected” amount of micro-stops as Uptime with a reduction in average speed over the time period measured. In the remote monitoring platform, to do this on a specific machine, the Minimum Production Speed is set to a value greater than 1 unit rate of production.
Monitoring the Instantaneous Speed of the machine alone can produce inaccurate results depending on the exact time of data sampling. If, over the course of a sampling interval (i.e. a minute), the Instantaneous Speed is sampled and found to be zero, then an assumption could easily be made that the machine was stopped over the entire sampling interval. However, this may not be the case because the machine may have actually been stopped for only a few seconds. It is not helpful to accumulate large numbers of “false stops” in these cases as each stop would result in a downtime event being created.
To detect and eliminate the creation of false stops, the Average Speed of the machine is examined over the period of time that is being measured. If the number of units produced during the sampling interval remains above the Minimum Production Speed, then the determination is made that the machine did not stop and no downtime event is created. This method is described in more detail as follows.
Consider the diagram below:
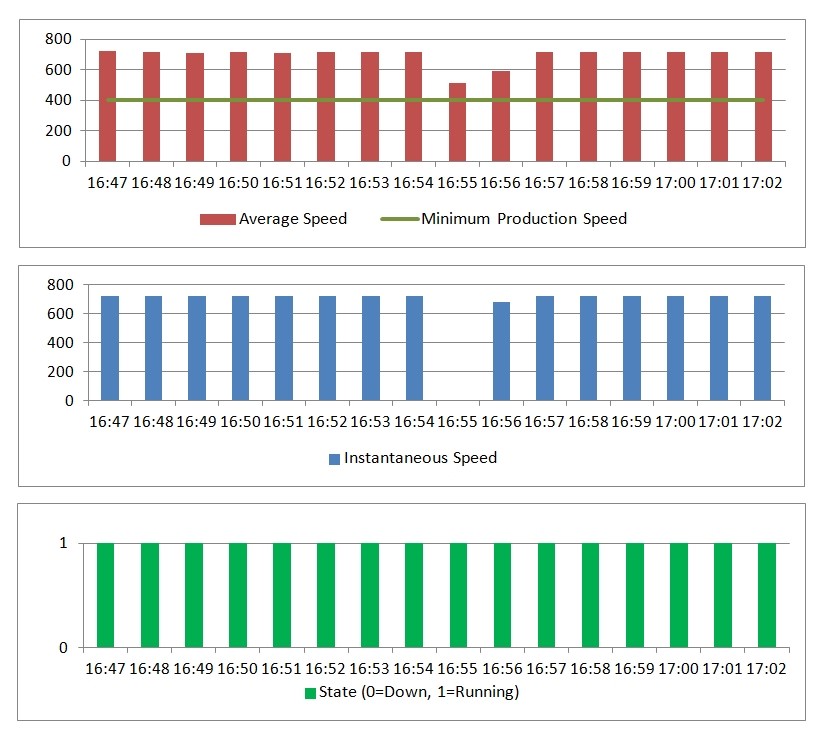
- At minute 16:54, the machine is producing normally at maximum speed. The Average Speed is above Minimum Production Speed, the Instantaneous Speed is above Minimum Production Speed, and the machine is determined to be running.
- At minute 16:55, the machine appears to be micro-stopping and is no longer producing at maximum speed. The Average Speed is still above Minimum Production Speed; however the Instantaneous Speed is zero because of when exactly the data was sampled within the minute. Overall, the machine is determined to still be running.
- At minute 16:56, the machine is now increasing back to maximum speed. The Average Speed is still above Minimum Production Speed, and the Instantaneous Speed is increasing. Overall, the machine is determined to still be running.
- At minute 16:57, the machine is back to producing normally at maximum speed. The Average Speed is above Minimum Production Speed, the Instantaneous Speed is above Minimum Production Speed, and the machine is determined to be running.
This example shows how the occurrence of the Micro Stop did not affect the reported state of the machine, but it did appropriately reduce the average speed reported.
You won’t see the OEE data displayed for a job until the next time a new job is started. For some situations (such as right after setting up a machine with job management or data collection) this may result in job details including OEE values not updating until a new job is started.
A term used in some areas of industry for downtime tracking, Makeready (or make-ready) is a term used for the time during which machine preparation occurs prior to run time. It is particularly used by continuous printing machines, and is similar to setup
You can read an explanation of each downtime assignment color here.
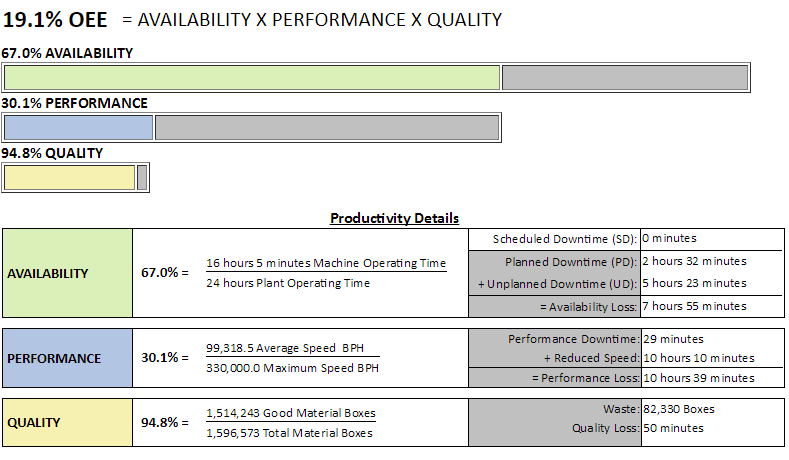
Overall Equipment Effectiveness – OEE – is a KPI (Key Performance Indicator) indicating the overall operational performance of the machine. It takes into consideration the cumulative impact of three factors: the equipment’s availability (percent of scheduled production time in which units are actually produced, also called the Machine Operating Time), performance rate (percent of material produced compared to standard) and quality (percent of good material produced compared to all material produced during the Machine Operating Time). To learn more about OEE, see Overall Equipment Effectiveness (OEE).
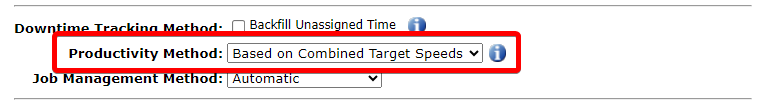
ei3 supports two ways of calculating the performance component of OEE. The local ei3 administrator can set the ideal maximum speed of the machine to use its designed theoretical maximum speed, which ei3 uses to evaluate OEE as a default standard, or to use the target speed of each individual job, product, or tool that is run on the machine, which ei3 uses to evaluate the OEE based on a combination of the target speeds of the jobs that are run on the machine. The selection of which of these options is being used for the machine will be displayed with the machine’s productivity data as either “Based on Maximum Machine Speed”, or “Based on Combined Target Speeds”, respectively.
Please note that ei3 calculates the productivity based on both methods at all times. The OEE method preference is only used to decide which of the two methods will be used to display productivity information to users in the Portal and in reports.
To decide which of the two OEE method preferences are applied to a specific machine, ei3 follows the logic described below:
- Use the method set on the machine level if one is set.
- Otherwise, use the method set on the location level if one is set.
- Otherwise, use the method set on the division level if one is set.
- Otherwise, use the method set on the company level if one is set.
- In all other cases, use the method set on the OEM partner level.
Machine-Level Productivity Method
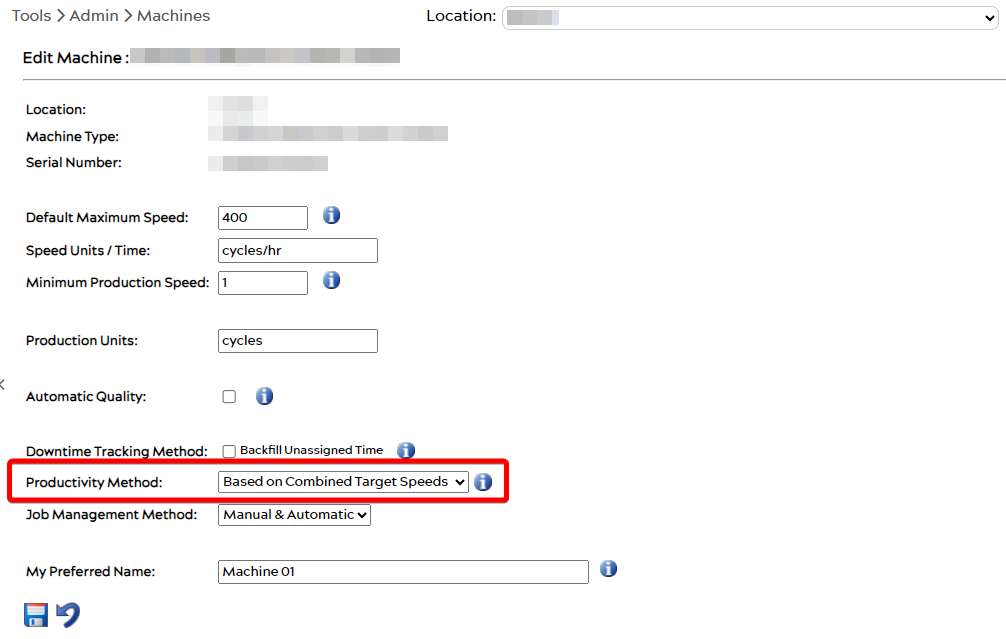
To set the OEE method preference on the machine level, a location, division or company admin must log into SERVICE, navigate to Admin > Machines, use the search function to locate the machine of interest, click the ![]() Edit button next to its name and select the Productivity Method from the dropdown.
Edit button next to its name and select the Productivity Method from the dropdown.
For machines, this setting can also be adjusted on the Customer Portal by clicking the gear icon in the main menu and, selecting Admin > Machines and clicking the ![]() Edit button next to the machine of interest:
Edit button next to the machine of interest:
Location-Level Productivity Method
To set the OEE method preference on the division level, a partner super-admin must log into SERVICE, navigate to Admin > Locations, use the search function to locate the location of interest, click the ![]() Edit button next to its name and select the Productivity Method from the dropdown:
Edit button next to its name and select the Productivity Method from the dropdown:
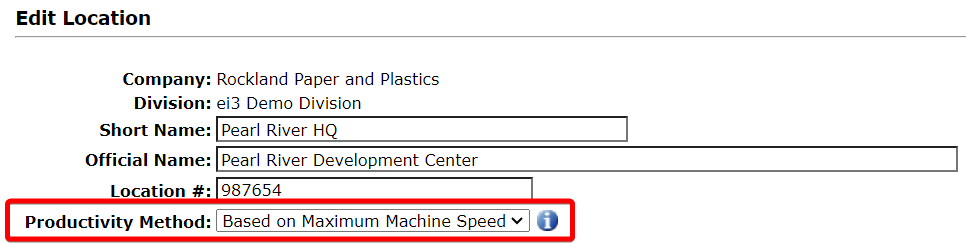
Changing the default method on the location level will affect machines created in the future; existing machines in the location will continue using the previously selected method.
Division-Level Productivity Method
To set the OEE method preference on the division level, a partner super-admin must log into SERVICE, navigate to Admin > Divisions, use the search function to locate the division of interest, click the ![]() Edit button next to its name and select the Productivity Method from the dropdown:
Edit button next to its name and select the Productivity Method from the dropdown:
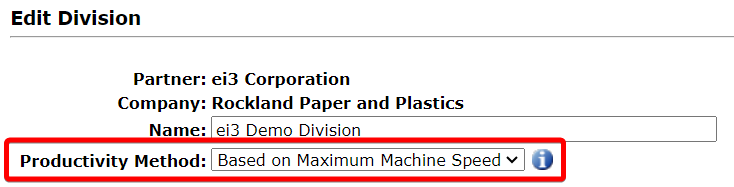
Changing the default method on the division level will affect locations created in the future; existing machines in the division will continue using the previously selected method.
Company-Level Productivity Method
To set the OEE method preference on the company level, a partner super-admin must log into SERVICE, navigate to Admin > Companies, use the search function to locate the company of interest, click the ![]() Edit button next to its name and select the Productivity Method from the dropdown:
Edit button next to its name and select the Productivity Method from the dropdown:
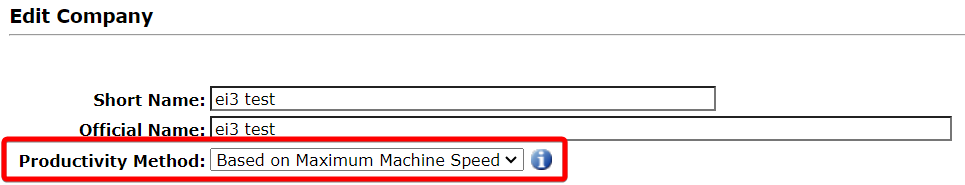
Changing the default method on the company level will affect divisions created in the future; existing machines in the company will continue using the previously selected method.
OEM Partner-Level Productivity Method
To set the OEE method preference on the OEM partner level, a partner super-admin must log into SERVICE and navigate to Admin > System Settings.
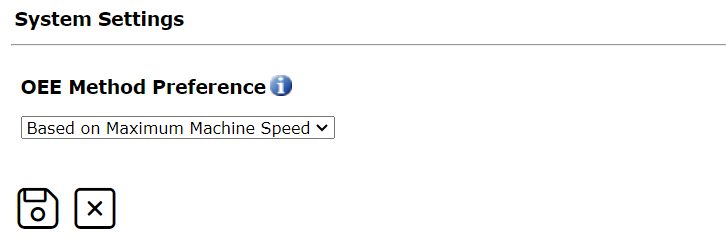
Changing the default method on the OEM partner level will affect companies created in the future; existing machines will continue using the previously selected method.
Recipe Management
In Recipe Management, there are some alarm triggers which will set off audible alarms if the right conditions are met.
When a recipe is currently running on the machine and alarms are in an active state, ei3 will sound an audible alarm for the system to alert users that a recipe set point has triggered an alarm.
To resolve the alarm, a user can click the check mark symbol to acknowledge the alarm. (Clicking the check mark symbol in the top of the Status column acknowledges all active alarms).
An alarm will remain in the alarmed state until the point is back in range of the set point or the recipe is changed. After an alarm has been acknowledged it will not sound any further audible alarms. (Another alarm trigger will cause the audible alarm to sound again).
Remote Monitoring
Some charts such as the Remote Monitoring Productivity chart include the acronyms MO and PO.
MO stands for Machine Operating Time, which represents the total operation time of the machine. This duration is calculated based on the number of minutes of collected machine production time.
PO stands for Plant Operating Time, which is measured by the machine’s configured shift schedule. If a machine has a shift schedule of 3 8-hour shifts per day, the PO of the day should be 24. (PO of each shift would remain at 8).
Additionally, PO also relies on any downtime code defined as a Scheduled downtime type. Reasons for scheduled downtime include shutdowns, holidays, and other times. This type of scheduled downtime is assigned to a machine through the Downtime Tracking application. Read more about downtime types here.
Even if your machine badge is showing data for your machine, or the Remote Monitoring Snapshot is displaying up-to-date values, you may not see data displayed on your machine charts under Remote Monitoring – Productivity.
Some possible reasons for this are listed below. If the issue is not listed or the answers below do not correct the issue, contact us at e-services@ei3.com for support.
Chart “Summarize By” options are set incorrectly
Try changing the “Summarize By” options on the Productivity chart.
If the machine has not been running for a long time, Summarize By for the quarter, month, or even week may not display values. Try switching to chart view to summarize by day or by shift.
In some cases, often if the machine has just recently started collecting data, the Summarize By Job will not display information. Try switching to chart view to summarize by day or by shift.
Machine OEE data is incorrect
Try changing your machine max speed.
Try reallocating your machine’s shift schedule.
Remote Service
There are certain rules regarding the ability to revoke remote service authorizations.
- Customer users cannot revoke a remote service authorizations.
- e-Services users cannot revoke Customer remote service authorizations.
- Any Customer user can revoke remote service authorizations which they themselves created.
- Only customer Administrator users can revoke Customer remote service authorizations, and even then, only at or below their administrative level.
- Customer Company Administrator Users can revoke any Customer remote service authorizations.
The SERVICE product allows service technicians to remotely access machines and their devices instantaneously across the globe through a secure VPN tunnel.
For more details on SERVICE, see this article.
Some of ei3‘s Remote Service users may need to reach an FTP server on a machine device during a remote service session.
Any remotely accessible device that runs an FTP server must be configured to use passive mode FTP, with standard TCP ports 3001-3004 used for passive FTP data transfer, in order for a Remote Service user to successfully access it during a remote service session.
The selected TCP ports must also be allowed in the configurations of the Amphions used to create the remote connection to the device. For more information about how to do this see this article.
These requirements must also be met for the case when it is desired to access the FTP server of a machine device from some other device located on the customer’s factory site LAN. For more information about how to set up this case in ei3 for the proper Amphion configurations see this article.
If you’re having trouble connecting to machines using the VPN service (Remote Service), or you’re having issues with installing the ei3 VPN service client, it can be useful for us if you send a copy of your log file so we can more easily determine what’s going on. When you email us for assistance, please include a copy of the log file. You can find this file in the following folder:
C:\Program Files (x86)\ei3Corp\VPN Service\openvpnLog.txt
This function is only available for Remote Service Platform users.
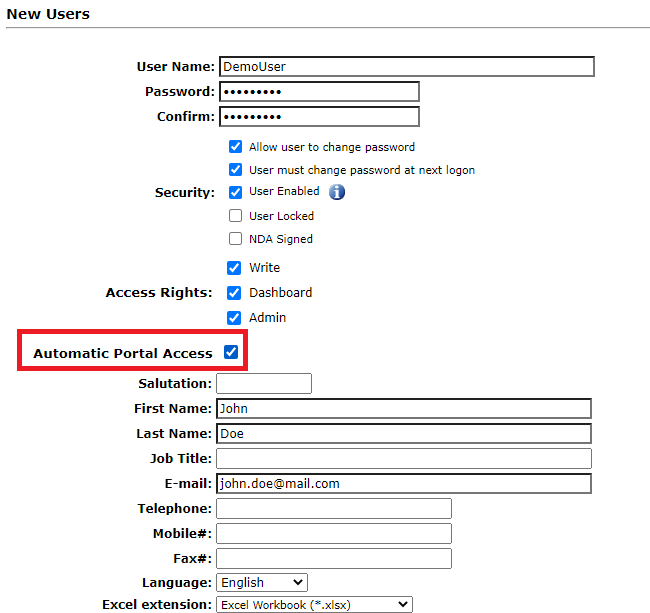
The Automatic Portal Access option can be found from the Remote Service Platform – Edit User page.
Search for a user (search all with the * symbol) – then click on the Edit icon ![]() to view the Edit User page.
to view the Edit User page.
When this function is enabled, the user immediately has access to all available customer portal applications, based on that user’s permission settings (all customers and machines for the combination of service office and product line permissions that is set up for that user). This function will also allow access to machines from the Mobile Portal.
The purpose of this is to reduce the amount of manual permission management required by admin users. By checking this box, the user will be able to access all available machines with a single click.
Third party users connect using remote service keys all the time. It’s easy to set up and send a link for any user to start a secure remote service session on your machine.
Note that the user sending the key does not need to have the remote service session software installed – only the user who is doing the remote service session will need to have the software installed on their computer.
To securely send a remote service key to another user, follow the steps below. You can also learn more in this article which describes the process in more detail.
Log in to the Remote Service Platform and navigate to the Machines tab, or
Log in to the Customer Portal and navigate to the Remote Service tab.
A list of available machines should appear on the page. If the page is blank, or your machine does not appear on the list, search for it using the available search bar.
In the Actions column for the machine, click on one of the three keys provided.
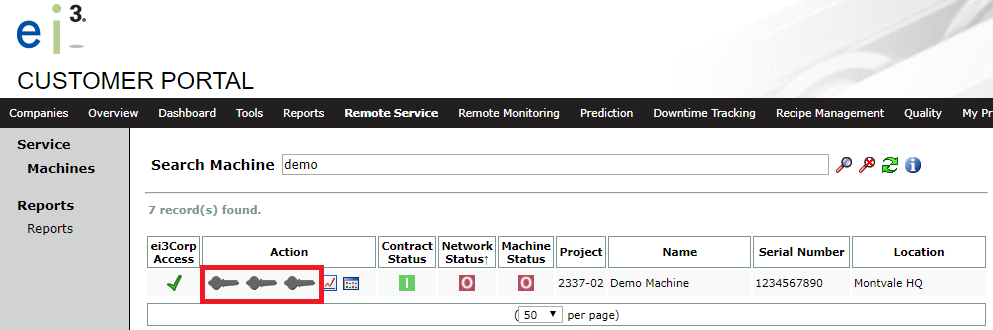
In the field for E-Mail Key, enter the recipient’s email address. Choose a duration for the key, and enter a password. (Remember this password and share it with the user securely).
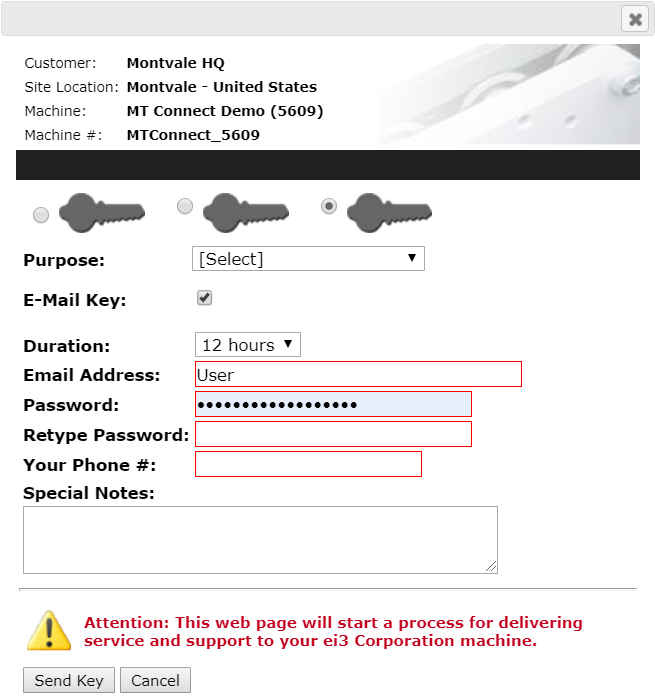
When all fields are complete, click Send Key. An email should be sent to the recipient within 10 minutes containing a link to start a secure remote service session with the selected machine.
NOTE: If the recipient does not see an email in their inbox, we recommend checking their spam folder.
As an OEM admin, it’s possible to allow or prevent remote service for a machine; as a customer user, this includes the ability to block an OEM user from doing a service session as well.
To do this, log in to the Remote Service Platform and navigate to Admin > Machines > Edit and find the section titled Machine Capabilities. Check the box to Allow Customer Remote Service.
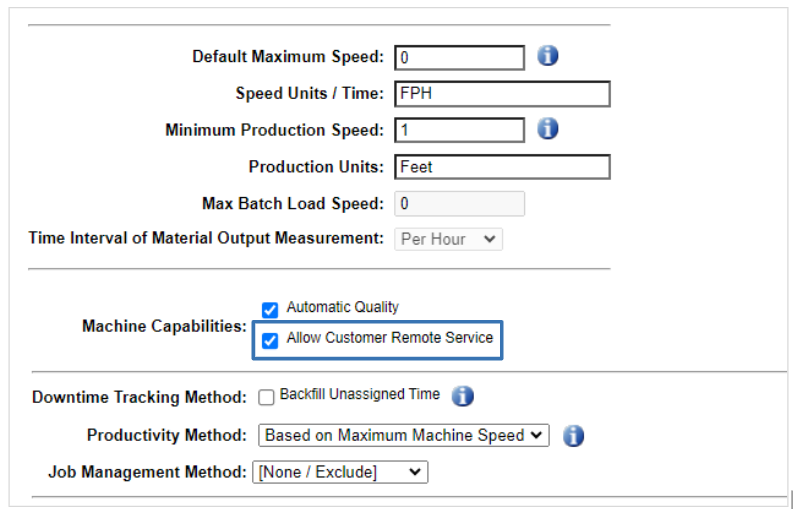
Doing so changes the check box on the Machines tab of the Remote Service platform.
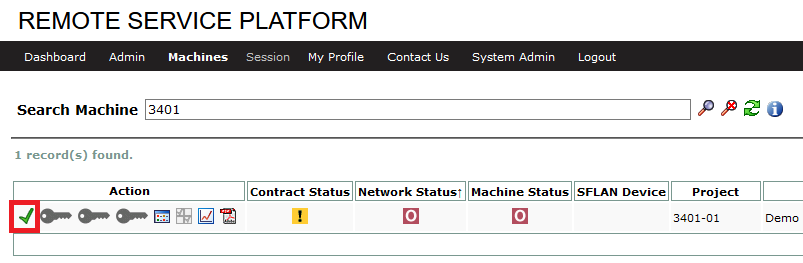
If access is not enabled, the check mark here will change to an X symbol to indicate that remote service access is not enabled.
Some special network setups involve isolated devices, sometimes on an external server, that while still on the same shop floor LAN is separate from the machines on that LAN. Such setups may require a patch update to the RSSD green box onsite before a remote service user can successfully access the isolated device(s).
To re-configure your green box RSSD to allow this change, you will need to do two things:
First, enable the feature on your RSSD by logging in to the Remote Service Platform and navigating to the Networks tab. Search for your network, then click the Edit icon ![]() to view the Edit Networks page.
to view the Edit Networks page.
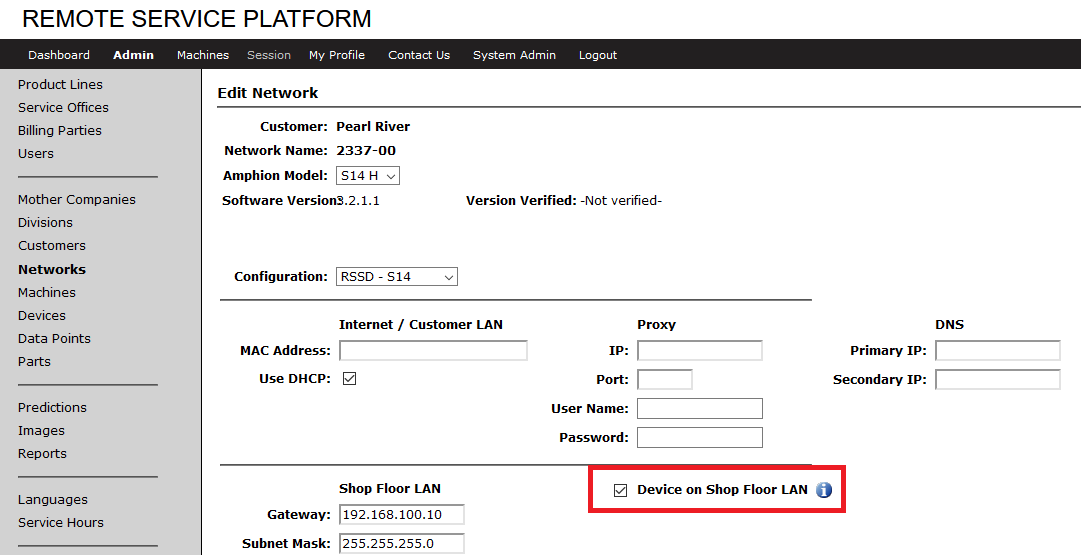
Check the box to enable Device on Shop Floor LAN, then scroll down to the bottom of the page and click the Save icon ![]() to save your changes.
to save your changes.
Next, you’ll need to patch your Amphion with the latest changes by generating a patch file for it. On the Networks page, click the Configuration icon ![]() to open the Configuration page, then click the New icon
to open the Configuration page, then click the New icon ![]() in the Action column to generate a new patch file. After ensuring that a new patch file has been generated, re-patch your Amphion following the instructions below:
in the Action column to generate a new patch file. After ensuring that a new patch file has been generated, re-patch your Amphion following the instructions below:
Search
This article describes search features that are specific to the function of search for machines in SERVICE or in the Customer Portal (but not to the search for machines in SERVICE > Admin > Machines!). Click here to find out more about the general search syntax used in ei3 web applications.
The search terms you enter will be applied to many fields associated with machines:
- The Project Name
- Machine information (Name, Model, Description, Serial Number, Product Line, Product Line Group, Additional Equipment)
- Amphion information (MAC Address)
- Location information (Name, Code, Division, City, Country)
- The Name of the Network that this machine is a part of
It is also possible to use the following special keywords in your searches (all keywords are case-insensitive):
- machonline or machoffline to narrow down the search results to machines that are currently online or offline, respectively.
- netonline or netoffline to narrow down the search results to machines located in networks that are currently online or offline, respectively.
Please note that the fields searched on the Machines page differ slightly from the ones searched on the SERVICE > Admin > Machines page. On the Machines page, your search terms will apply to the City and Country where the machine is located; on the Admin > Machines page, that’s not the case. On the other hand, several fields are only included in searches executed from the Admin > Machines page in SERVICE. See the relevant article for more information: How To Search For Machines in SERVICE > Admin?
This article describes search features that are specific to the function of search for machines in SERVICE > Admin > Machines (but not to the search for machines in other places). Click here to find out more about the general search syntax used in ei3 web applications.
The search terms you enter will be applied to many fields associated with machines:
- The Project Name
- Other machine information (Name, Model, Model Description, Description, Serial Number, Product Line, Product Line Group, Service Center, Additional Equipment)
- Amphion information (Model, Software Version, MAC Address)
- Location information (Name, Code, Company, Division)
- Last Name, Full Name and User Name of the First and Second Owner of the machine.
- The Name of the Network that this machine is a part of
It is also possible to use the following special keywords in your searches (all keywords are case-insensitive):
- enabled or disabled to narrow down the search results to machines that are enabled or disabled, respectively.
- machonline or machoffline to narrow down the search results to machines that are currently online or offline, respectively.
- netonline or netoffline to narrow down the search results to machines located in networks that are currently online or offline, respectively.
Please note that the fields searched on the SERVICE > Machines > Admin page differ slightly from the ones searched on the Machines page. On the Machines page, your search terms will apply to the City and Country where the machine is located; on the Admin > Machines page, that’s not the case. On the other hand, several fields are only included in searches executed from the Admin > Machines page: Model Name and Software version of the Amphion; Company Name; Service Center Name; Machine Model Description; all fields related to the First and Second Owner of the machine; the enabled status of the machine. See the relevant article for more information: How To Search For Machines?
This article describes search features that are specific to the search function in SERVICE > Dashboard. Click here to find out more about the general search syntax used in ei3 web applications.
The search terms you enter will be applied to the following fields; most of these fields are visible on this search page:
- Machine Name, Model Name, Serial Number, Project and Additional Equipment;
- Product Line Name;
- Location Name and Code; the City and Country where the machine is located.
It is also possible to use the following special keywords in your searches (all keywords are case-insensitive):
- machonline or machoffline to narrow down the search results to machines that are currently online or offline, respectively;
- netonline or netoffline to narrow down the search results to machines located in networks that are currently online or offline, respectively.
This article describes search features that are specific to the function of search for users in SERVICE > Admin or in the Customer Portal. Click here to find out more about the general search syntax used in ei3 web applications.
The search terms you enter will be applied to the fields visible on this search page (Username, First Name, Last Name etc.) as well as to the user’s Email, Company, location (City and Country) and their API key.
It is also possible to use the following special keywords in your searches (all keywords are case-insensitive):
- enabled or disabled to narrow down the search results to enabled or disabled accounts, respectively;
- locked or unlocked to narrow down the search results to locked or unlocked accounts, respectively;
- nda or nonda to narrow down the search results to users who have or have not signed the NDA, respectively.
- Several keywords that can be used to narrow down the search results based on the level of access configured for users: superadmin, nonsuperadmin, admin, nonadmin, dashboard, nodashboard, writer or nonwriter; see below for an important note.
Important note: this search targets the exact same fields and keywords whether it is executed from the Customer Portal or from the SERVICE > Admin > Users page. It means that fields such as Company Name, City and Country – not visible in the Portal – are included in the search, and that the keywords targeting access levels do not correspond to the nomenclature used in the Portal, i.e. to Location, Division and Company Admin – but to concepts used in SERVICE > Admin > Users.
This article describes search features that are specific to the function of search for networks in SERVICE > Admin. Click here to find out more about the general search syntax used in ei3 web applications.
The search terms you enter will be applied to many fields associated with networks:
- The Network Name, also known as the Project Id;
- The MAC address;
- Most of the configured IP addresses (IP, Subnet Mask, Gateway, Proxy IP, Primary and Secondary DNS, Shop Floor LAN);
- The software version of the Amphion;
- The Proxy User Name;
- The Location Name and Code, and the Company Name where the network is installed.
It is also possible to use the following special keywords in your searches (all keywords are case-insensitive):
- enabled or disabled to narrow down the search results to networks that are active or inactive, respectively;
- netonline or netoffline to narrow down the search results to networks that are currently online or offline, respectively;
- dhcp or nodhcp to narrow down the search results to networks that use or do not use DHCP, respectively.
This article describes search features that are specific to the function of search for devices in SERVICE > Admin. Click here to find out more about the general search syntax used in ei3 web applications.
The search terms you enter will be applied to many fields associated with devices and machines:
- General device information (Name, Manufacturer, Category, Serial Number, Model, Location);
- Access information of the device (Username and Host Name);
- Networking information of the device (Argo IP Address and Local IP Address);
- Information about where the device is located (Location Name and Code);
- Information about the machine where the device is installed (Name, Serial Number, Project Name, Product Line Name).
It is also possible to use the following special keywords in your searches (all keywords are case-insensitive):
- machonline or machoffline to narrow down the search results to devices connected to machines that are currently online or offline, respectively;
- isedgedevice or isnotedgedevice to narrow down the search results to devices classified as edge or non-edge, respectively; note that not all OEMs support the edge classification for devices.
This article describes search features that are specific to the function of search for data points in SERVICE > Admin or in the Customer Portal. Click here to find out more about the general search syntax used in ei3 web applications.
The search terms you enter will be applied to many fields associated with data points configured for data collection: Tag Name and Type, Description, Category, Data Type, Address, and Units.
Your search terms will also apply to Device Names and Machine Names associated with the data points.
It is also possible to use the following special keywords in your searches (all keywords are case-insensitive):
- scale to narrow down the search results to data points with configured scale equations;
- statistics to narrow down the search results to data points with statistics enabled;
- export to narrow down the search results to data points with export enabled;
- charting to narrow down the search results to data points with charting enabled;
- alert to narrow down the search results to data points with alerting enabled.
- cyclic to narrow down the search results to cyclic data points;
- trigger to narrow down the search results to trigger data points;
- target to narrow down the search results to data points that have a Target Data Point configured.
This article describes search features that are specific to the function of search for parts in SERVICE > Admin. Click here to find out more about the general search syntax used in ei3 web applications.
The search terms you enter will be applied to fields associated with parts:
- Information about the part itself (Name, Description, Category and Subcategory).
- Information about where the part is located (Location Name and Code).
- Information about the machine where the part is installed (Type, Serial Number, Project Name).
You may also use two keywords active or inactive to narrow down the results only to parts that are currently enabled or not, respectively. All keywords are case-insensitive.
This article describes search features that are specific to the function of search for MRFD (red box) default ports in SERVICE > Admin. Click here to find out more about the general search syntax used in ei3 web applications.
The search terms you enter will be applied to the names, descriptions and port numbers.
You may also use two keywords tcp or udp to narrow down the results only to ports of the specified type, e.g. tcp 950. All keywords are case-insensitive.
Please note that ports allowed on the machine and device levels will not be listed in your search results. This article is only applicable to searching the master list of TCP / UDP ports that will be allowed on all red and black box Amphions in the fleet.
This article describes search features that are specific to the function of search for predictions in SERVICE > Admin. Click here to find out more about the general search syntax used in ei3 web applications.
The search terms you enter will be applied to various fields related to predictions:
- The Name and Description of the prediction;
- The Name, Description and categories of the related parts;
- The Name, Serial Number and Project Name of the related machines.
You may also use two keywords active or inactive to narrow down the results only to predictions that are active or inactive, respectively. All keywords are case-insensitive.
This article describes search features that are specific to the function of search for part specifications (“Spec Parts and Tools”) in SERVICE > Admin. Click here to find out more about the general search syntax used in ei3 web applications.
The search terms you enter will be applied to various fields related to part specifications: Type and Subtype, Part Name and Number, and Product Line.
You may also use two keywords active or inactive to narrow down the results only to part specifications that are active or inactive, respectively. All keywords are case-insensitive.
This article describes search features that are specific to the function of searching the tool inventory in SERVICE > Admin. Click here to find out more about the general search syntax used in ei3 web applications.
The search terms you enter will be applied to various fields associated with tools: Name, Type, Manufacturer Id, Electronic Id, Owner Asset Id and Makers Tool Id.
You may also use two keywords active or inactive to narrow down the results only to tools that are active or inactive; it is the same information as what is displayed in the Active column. All keywords are case-insensitive.
This page describes the general principles that apply when you try searching for things in ei3.
Some searches also have dedicated FAQ articles that describe special features or keywords available. The easiest way to obtain this information is clicking the “?” icon next to the search field directly in ei3 (if available). A popup will appear, describing the general search tips and the advanced search options (this information is exactly the same as what can be found on this FAQ page). If an FAQ article containing more details exists, the aforementioned popup will contain a link to it:
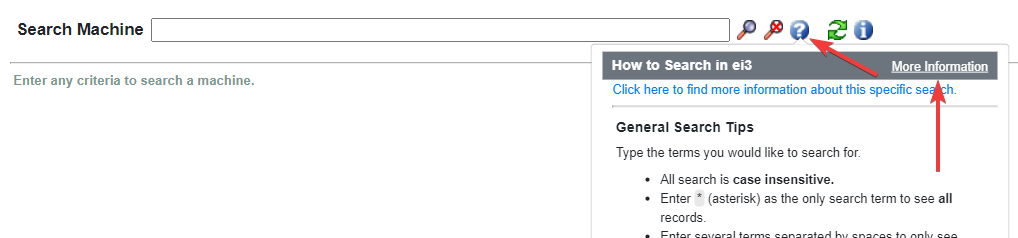
If the popup does not contain any additional links, it means that the search is very straightforward and only based on the fields visible on the page. Such searches do not have any additional special features or keywords.
General Search Tips
On the most general level, all you need to do is type the terms you would like to search for.
- All search is case insensitive.
- Enter * (star) as the only search term to see all records.
- Enter several terms separated by spaces to only see results that contain both terms, e.g. press london.
- If the search term you are interested in contains spaces, enclose it in double quotes, e.g. “great lakes”.
- You can use the wildcard character * before or after any term to indicate that successful matches should start or end with the given term, e.g. *ville or press*.
Advanced Search Options
- Combine terms with and or & to only see results that contain both terms, e.g. press and london.
- Combine terms with or or | (pipe) to see results that contain either one of them, e.g. press | pump.
- Enter not or ! before a term to only see results that do not contain this term, e.g. not pump or !pump.
- You may group terms using parentheses to help with readability, e.g. press and (not “great lakes”).
- In complex queries, stick to one style when combining terms: use either words (and, or, not) or symbols (&, |, !). Mixing styles will not work.
Smart Headset
In order to qualify as a Smart Headset session, the following conditions need to be met:
- The machine must be headset equipped.
A headset equipped machine will be marked with a visible headset icon shown next to it. (A non-equipped machine will display a greyed out icon
  displayed next to it).
 - The user must be using the VPN Service in making the remote service session. (i.e. other leased line methods are not eligible)
- During the remote service session, at least 1 full second of TCP/IP traffic must be observed by the VPN Service between the end-user and the glasses as reported by the VPN Service and the ei3 web service upon the closure of the service session.
If these conditions are not met, the session will not be counted as a Smart Headset session.
Tools
To download Tracker, go to the Tools menu, and select Tracker. See the Tracker article for more details.
You can find a user’s API key under Admin Tools -> Users. Click the edit ![]() icon in front of a user account. You can find the associated API Key# at the bottom of the user edit page.
icon in front of a user account. You can find the associated API Key# at the bottom of the user edit page.
Similarly, when creating a new user account, you can find the new account’s unique API Key# at the bottom of the user creation page.
API keys are also listed under Tools > API Access. Here, sample API usage for specific API calls are also listed. Read more about it here.
In short, an application programming interface (API) is a particular set of rules and specifications that software programs can follow to communicate with each other. It serves as an interface between different software programs and facilitates their interaction, similar to the way the user interface facilitates interaction between humans and computers.
Practically speaking, this allows for customers to create customized data dashboards and andon displays as needed using ei3’s secure API calling system. Using the ei3’s Customer Portal as an example, a user can create API calls to request specific data (machine speed for example) from ei3’s data collection servers. When the correct ‘key’ is provided (as per a user’s unique API access key) the server ‘unlocks’ the requested information and sends it along to the end user as requested.
A coded API ‘key’ can open a virtual door for the ei3 API to provide allowed information to the end user. It’s actually a long set of numbers and letters that keeps information secure. But anyone with valid ei3 API key can retrieve the information they have permissions for. For convenience, all users can create their own API keys for permitted machines.
Users who create API keys should be aware that their keys will only work as long as their user account is enabled. For a more permanent key, it is possible to create a system key, something that can only be done by administrators.
For more information on API keys and access, see this article.
In Job Management, steps can be assigned to specific jobs based on the state in which the job is in. This can be tracked through ei3 or fed in by MES or ERP systems at your facility.
Some jobs use steps, especially in conjunction with other applications such as quality or recipe management. If the same job name shows up on two different machines, ei3 will mark these steps as “Step 1” and “Step 2” even if they both are the first step on their respective machines. To prevent this occurrence, make sure that you use different job names or isolate your machines to different operations.
From the Tools page in the Customer Portal, go to Job Management > Operations
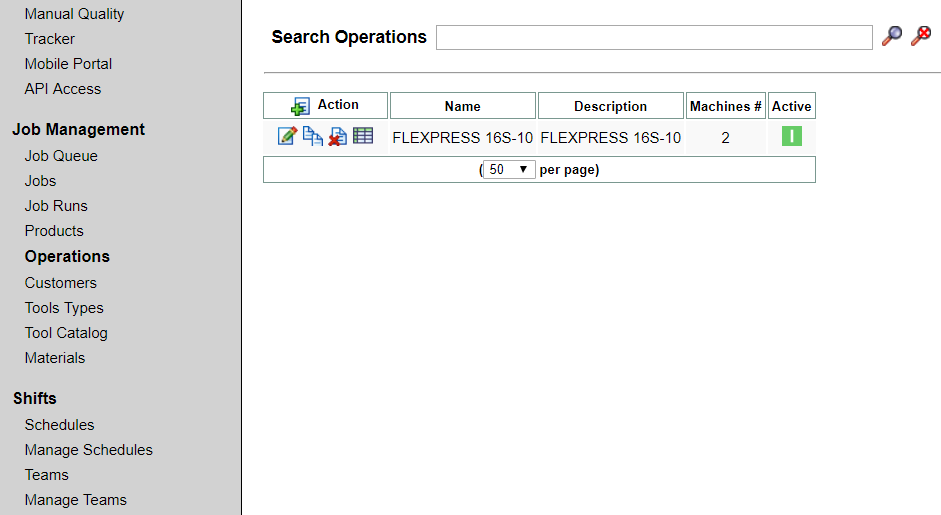
Click the Edit icon ![]() to open the Edit Operations page.
to open the Edit Operations page.
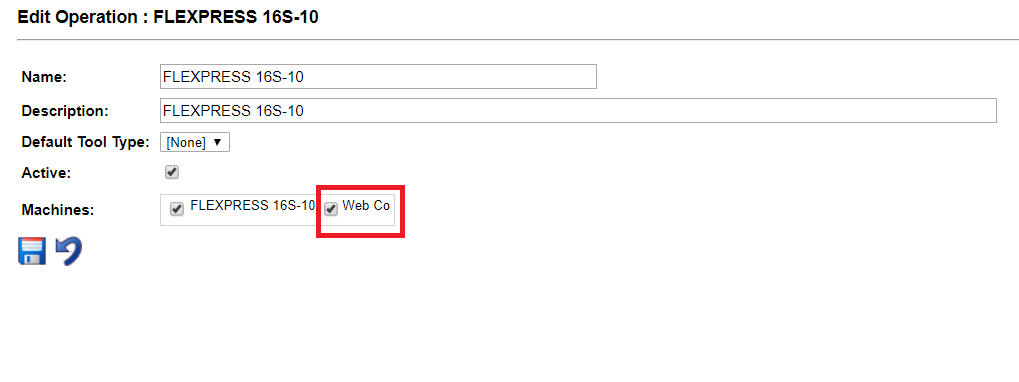
Deselect all but one machine in order to isolate it from the others. This will prevent job steps from jobs of the same name from being tracked across several machines.
Click Save ![]() to record your changes.
to record your changes.
To track jobs on the deselected machines, click the New icon ![]() to create a new operation for each of the other machines you deselected earlier.
to create a new operation for each of the other machines you deselected earlier.
Provide a name and description, select the machine from the provided checkboxes, and click Save ![]() .
.
Your jobs will be tracked across all active machines independently, and will not share steps across one another.
OEE metrics for calculating machine productivity rely on machine max speed settings. For machines with Job Management enabled, this number can change based on the currently running job.
Job productivity data is no different from shift or day productivity data. Once the job run is the completed the data summarized and stored as a record in a table.
Once a speed is set, it is locked in for that job run – further changes to the product’s target speed will not impact the current job run. The new target will take effect the next time the product is run on the machine.
Users
See User Creation for information regarding users.
When you want to remove or delete a user, remember that for long-term audit purposes we don’t completely eliminate the record of that person having once been allowed in. Instead, we disable the user, which blocks their account from all access to the system. Additionally, for security purposes, it’s impossible to disable a user who has admin rights equal to or higher than your own.
To disable a user:
- Log in to the Remote Services platform.
- From the menu bar, select Admin Tools > Users.
- Use the search bar to search for a user, or search using the * symbol to display a list of all users.
- Click the edit icon to select a user to edit from the list.
- Uncheck the User Enabled box.
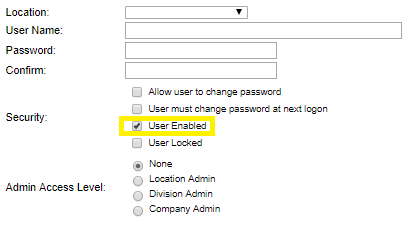
For more information on users, see Category: Users
From My Profile, click the Change Password menu item on the left side of the page.
- In the Old Password field, type in your old password.
- In the New Password field, type in the password you would like to change to.
- In the Confirm field, re-type the password you would like to change to.
The New Password field and the Confirm field must match. Click the save ![]() icon to save changes.
icon to save changes.
Clicking the back button in your browser will cause you to lose any unsaved changes.
The User Groups function makes it easy to set up several user permissions for several machines with far less clicks.
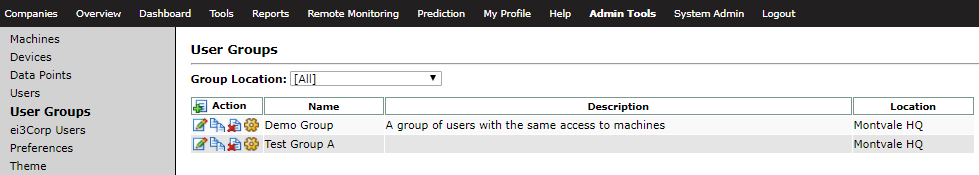
If you’re setting up several users with the same permissions, rather than clicking through several times on each user to set up their individual permissions, you can make a user group with the set permissions and assign the user to that group. This can be done during user creation or by clicking Edit ![]() next to a user, then checking the desired User Group box at the bottom of the Edit page.
next to a user, then checking the desired User Group box at the bottom of the Edit page.
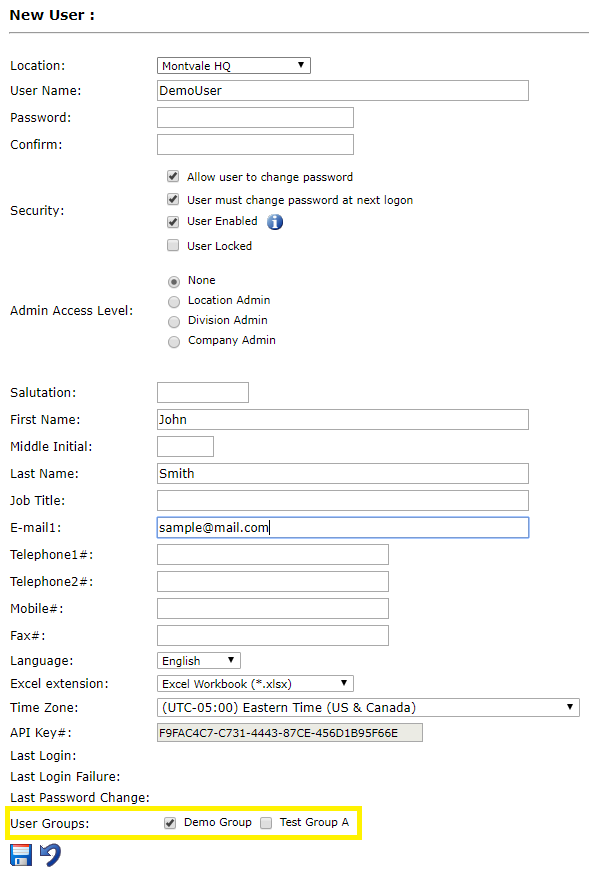
Once complete, click Save ![]() . The user group permissions will be assigned to that user.
. The user group permissions will be assigned to that user.
For more information on using this function, see User Groups.
There are two types of user permissions:
A user’s Admin Access Level (found on the New User or Edit User page) allows users the following permissions:
- None – No special access all permissions must be granted explicitly. Regular users have no visibility to the “Admin Tools” menu.
- Location Admin – User has implicit permissions to all products & machines in their location. Location Admins can create or update any user within their Location.
- Division Admin – User has implicit permissions to all products & machines in their Division. Division Admins can create or update any user within their Division.
- Company Admin – User has implicit permissions to all products & machines in their Company. Company Admins can create or update any user within their Company.
A user’s Permissions (found on the User Permissions page) allow the following permissions levels:
- None – User has no permission whatsoever to the product on the machine.
- Read Only – User has read only permission to the product on the machine.
- Read Write – User has read & write permission to the product on the machine.
- Administrator – User has Administrator permission to the product on the machine.
For information on specific user permissions and what they allow, see the User Permissions Chart.
For more information on users, see this article.
Unlike other products in the Customer Portal, the Remote Service product only have two user permission levels: None and Administrator.
While anyone can access Remote Service through a secure access key, only administrators can create them.
A user with access level of None may not create keys, but can still access a machine with a valid key created by an Administrator level user.
See also: User Permissions Chart
Our system stores user names from across all companies and customers to one single database. This means if a user has already taken a username, it will not be available for your use even if it does not show up on your list of users.
If you have tried to create a user but had trouble saving the user, you may have seen a message: “Item with the same name already exists. Please change name and try again.”
In such cases, the username you’ve tried to enter is already in use. Try the following changes to your username in order to have it saved correctly:
- Add numbers. jsmith may be taken, but jsmith739 is likely to be still available.
- Add an underscore. j_smith_02 for example.
- Use your company name or acronym. abc_co_smith will be a unique username and likely not in use.
A password reset is only a few clicks away. Follow the steps below to get yourself set up with a new password.
From the Login page (Remote Service OR Customer Portal), click the Forgot Password link.
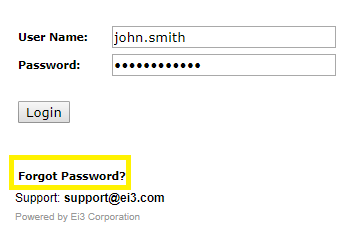
Fill out the text fields provided on the Reset Password page. You will need to provide your user name and the email address associated with your user account.
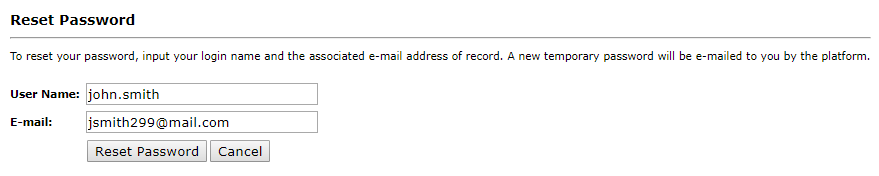
Check your email. Within a few minutes, you should receive an email with a temporary password to log you in.
Once logged in, you’ll be required to change your password.
If you no longer have access to the email address associated with your account, contact us for assistance at e-services@ei3.com.
This function is only available for Remote Service Platform users.
The Automatic Portal Access option can be found from the Remote Service Platform – Edit User page.
Search for a user (search all with the * symbol) – then click on the Edit icon ![]() to view the Edit User page.
to view the Edit User page.
When this function is enabled, the user immediately has access to all available customer portal applications, based on that user’s permission settings (all customers and machines for the combination of service office and product line permissions that is set up for that user). This function will also allow access to machines from the Mobile Portal.
The purpose of this is to reduce the amount of manual permission management required by admin users. By checking this box, the user will be able to access all available machines with a single click.