OEE is a KPI (Key Performance Indicator) indicating the overall operational performance of the machine. It takes into consideration the cumulative impact of three factors: the equipment’s availability (percent of scheduled production time in which units are actually produced, also called the Machine Operating Time), performance rate (percent of material produced compared to standard) and quality (percent of good material produced compared to all material produced during the Machine Operating Time).
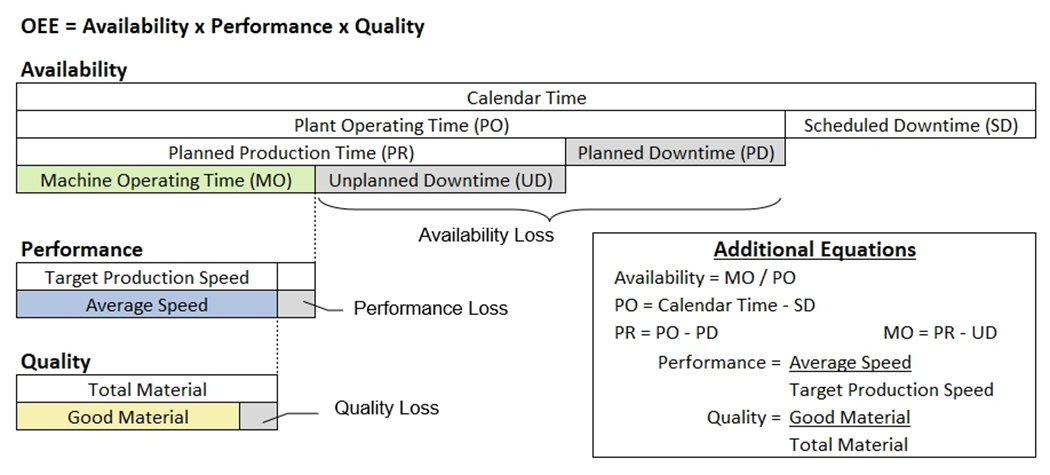
OEE = % Availability x % Performance x % Quality
It is unlikely that any manufacturing process can run at 100% OEE. Many manufacturers benchmark their industry to set a challenging target, 85% is not uncommon.
Availability is a measure of the time a machine has been up and running and producing material without any downtime. This metric is dependent upon the time that the machine has been scheduled for production, called the Plant Operating Time. ei3 uses data that it reads from the machine to compute the downtime called the Availability Loss, as the amount of time that the machine has not been producing material or has been running below its minimum threshold speed during the Plant Operating Time. Both the minimum speed and the Plant Operating Time are defined within the system by the customer. Availability Loss may be further sectioned into Planned and Unplanned Downtime.
Availability = MO / PO
- Scheduled Downtime (SD) – This is the time that the plant or machine is scheduled to not be in operation. Reasons for scheduling downtime include plant shutdowns, local holidays, and other times. The shift schedule for a machine is entered into the ei3 system by the local ei3 administrator. Any period of downtime of a machine can be assigned as Scheduled Downtime by a DOWNTIME user, or automatically by the system if set up to do so.
- Plant Operating Time (PO) – This is the time the plant is scheduled for production operations, that typically does not include shutdowns, holidays, and other times when the plant is not scheduled to operate.
PO = Calendar Time – SD. - Planned Downtime (PD) – This is the time during Plant Operating Time when the particular machine is scheduled to not be running. Reasons for planned downtime may include: no material to produce because of a line restraint, breaks, meetings, maintenance, and others. Any particular period of downtime measured on a machine can be assigned as Planned Downtime by a DOWNTIME user or automatically by the system if set up to do so.
- Planned Production Time (PR) – This is the portion of time that the particular machine is scheduled and planned to be available for production operation, sometimes referred to as Loading Time. It is Plant Operating Time (PO) minus all Planned Downtime (PD).
PR = PO – PD - Unplanned Downtime (UD) – This is the unplanned downtime of the machine. Reasons for unplanned downtime include technical or mechanical failures, material or operator issues, and others. All downtime periods default to the Unplanned Downtime type unless they are assigned a different type, either automatically by PLC code or manually by a DOWNTIME user.
- Machine Operating Time (MO) – This is the time that the particular machine was running and producing material. It does not include scheduled, planned or unplanned downtime. Also called Uptime, it is the Planned Production Time (PR) minus all Unplanned Downtime whether assigned a reason or not.
MO = PR– UD - Availability Loss – This is the amount of time that the machine was not running and producing material during the time it was scheduled to be available. It is the total of Planned and Unplanned Downtime.
Availability Loss = PO – MO = UD + PD
Performance values in the OEE metric represent the average speed at which the machine runs during the Machine Operating Time (MO) of the calendar time period being evaluated, as a percentage of the ideal maximum speed of the machine. It is a measure of the quantity of units actually produced as a percentage of the quantity of units that would have been produced in that same MO time period if the machine were running at its ideal maximum speed. For the purposes of evaluating OEE, the local ei3 administrator can set the ideal maximum speed of the machine to use its designed theoretical maximum speed, which ei3 uses to evaluate OEE as a default standard, or to use the target speed of each individual job, product, or tool that is run on the machine, which ei3 uses to evaluate the OEE based on a combination of the target speeds of the jobs that are run on the machine. The selection of which of these options is being used for the machine will be displayed with the machine’s productivity data as either “Based on Maximum Machine Speed”, or “Based on Combined Target Speeds”, respectively.
- Performance Loss – This is the difference between the actual quantity of units produced and the theoretical maximum quantity of units that could have been produced during the Machine Operating Time. It can be represented in units of time, material or speed. Performance Loss may be sectioned by Performance Downtime and Reduced Speed. Any particular period of downtime measured on a machine can be assigned as Performance Downtime by a DOWNTIME user or automatically by the system if set up to do so. Reduced Speed is the remaining amount of time lost making the actual quantity of units produced because the average speed of the machine was less than its maximum speed.
Reduced Speed = Performance Loss – Performance Downtime
Quality is represented by the quantity of Good Material produced as a percentage of the Total Material produced during the Machine Operating Time (MO) of the time period being evaluated. This is commonly referred to as First Pass Yield.
- Total Material – This is the total quantity of material produced, as observed by ei3. The Total Material value comes from the machine controller.
- Good Material – This is the total number of good units as measured by on-machine quality inspection systems. If there is not an on-machine quality inspection system in place, then the value can come from data entered by users of the Scrap Tracking module in PRODUCTION.
Good Material = Total Material – Waste - Quality Loss – This is the equivalent amount of time lost by the production of bad material, or Waste, during the running time (MO) of the machine. Waste is the total number of rejected units of production (for any reason, typically scrap or rework), as measured by on-machine quality inspection systems. If there is not an on-machine quality inspection system in place, then the value can come from data entered by users of the Scrap Tracking module in PRODUCTION.
