The Daily Performance Report and Shift Performance Report provide simple machine details over the selected period. They are easy to set up and can be automatically shared via email through our scheduled reports function, explained here.
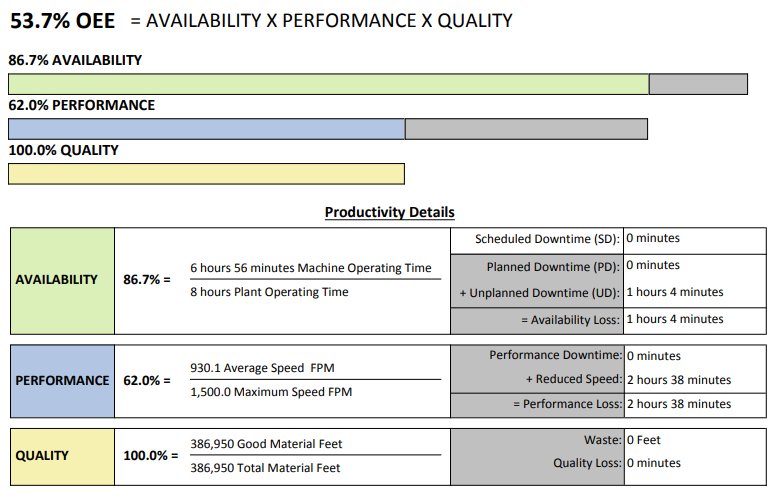
OEE Details
The first section displays the OEE and performance details over the selected time period. Underneath is a breakdown of each OEE metric and an explanation of how it is calculated.
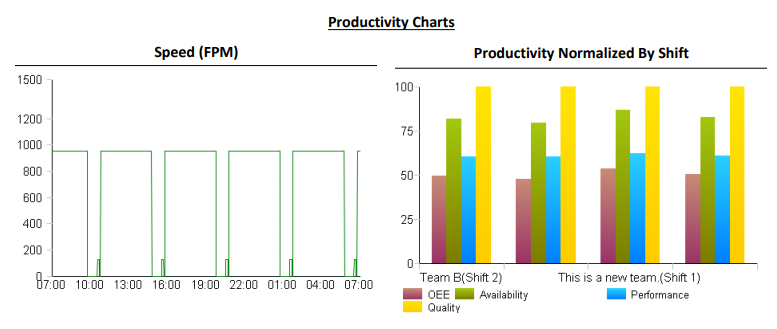
Productivity Charts
Machine speed is shown in a graph and productivity data displayed as raw values in a table underneath. Each metric of OEE is displayed in a chart showing productivity normalized by shift. Shift Teams assigned to any listed shifts in this time frame are shown here beneath the graph.
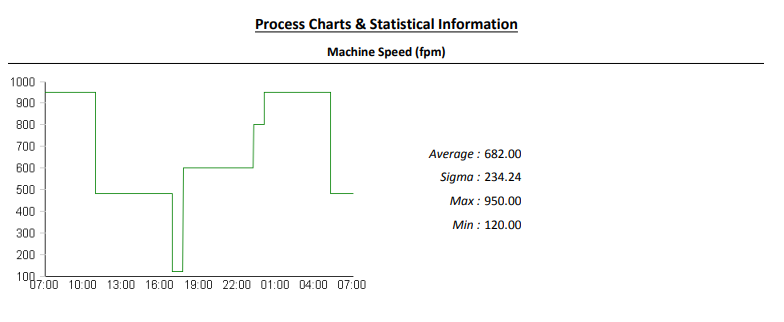
Process Charts & Statistical Information
Displays pertinent machine data details, including the average, sigma, max, and min values.
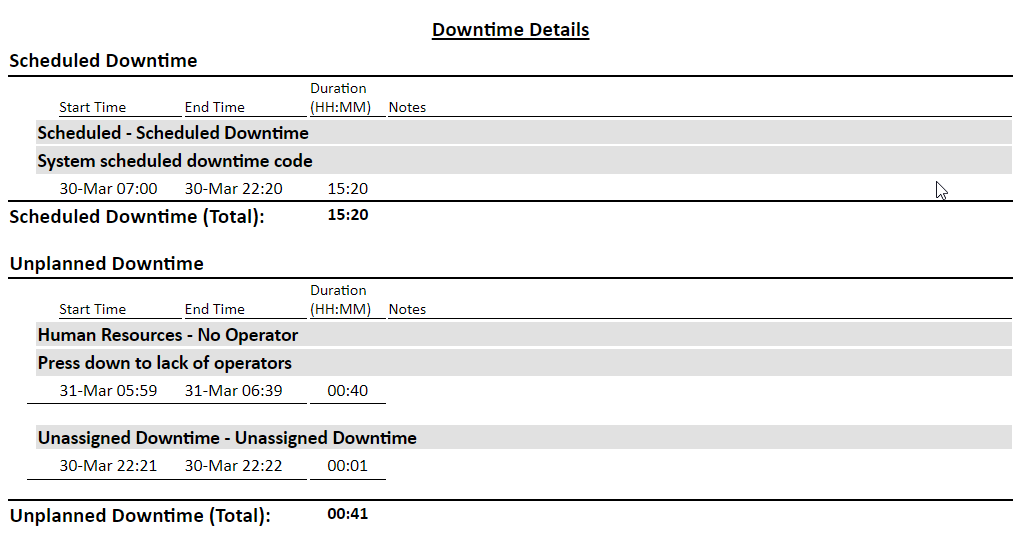
Downtime Details
Lists all downtimes which occurred during the defined time period.
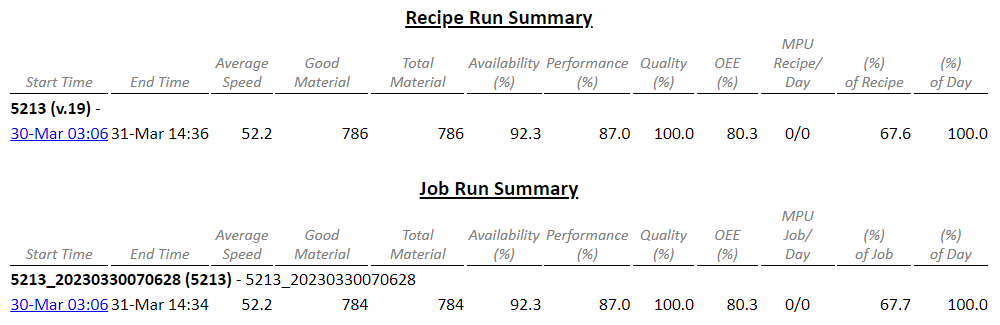
Recipe & Job Run Summary
Lists all recipe & job runs (if machine is set up for these capabilities) during the defined time period.
Glossary
If selected, a Glossary is included which defines important information and terms used in the report.
