Data without insights has no value. In most practical settings, insights are gained by providing users with visual representations of data that allow them to better understand their environment, plan and prioritize their activities, and react to problems. In ei3, one of the key applications designed for this purpose has always been the INSIGHTS Overview dashboards. Those dashboards used to be solely focused on OEE and productivity. In February 2023, the dashboards received a major facelift, allowing for more customizability, more badge types, and different layouts – all designed to give ei3 users more relevant information, more quickly.
- Layouts
- Badge Types
- Badge Information
- Creating Dashboards
- Customizing Dashboards
- Deleting Dashboards
- Other Options
- Other Ways to Monitor
Default Dashboard
When you first open the INSIGHTS Overview page for a specific location in ei3, a default dashboard is displayed, composed of productivity badges for every eligible machine at this location. This dashboard is called All. This is the quickest way to get started with data monitoring – and you will be able to easily change the dashboard to your liking by clicking the Edit button in the top-right corner or by creating a brand new one; see below for an explanation of how to edit existing dashboards and create new ones.
Layouts
INSIGHTS Overview dashboards can be displayed using four different layouts:
- Large grid layout; for productivity badges, it is very similar to how INSIGHTS Overview dashboards used to be displayed.
- Small grid layout; it is a more dense version of the large grid layout – the badges are smaller and, therefore, more of them fit on the screen.
- Table layout; instead of the bulky rectangles, each badge is a single slim rectangular line; just like the small grid layout, the table one is suitable for creating higher density displays.
- Factory layout; small, square badges are overlaid on top of a background image that is intended to visualize the factory or the manufacturing process.
You can switch between the layouts using the following toggle, located in the top-right corner of the Overview page:

Some dashboards may have a more limited choice of layouts. The creator of the dashboard decides which layouts are to be made available for viewing.
Below is an example of the same dashboard displayed using the four different layouts:
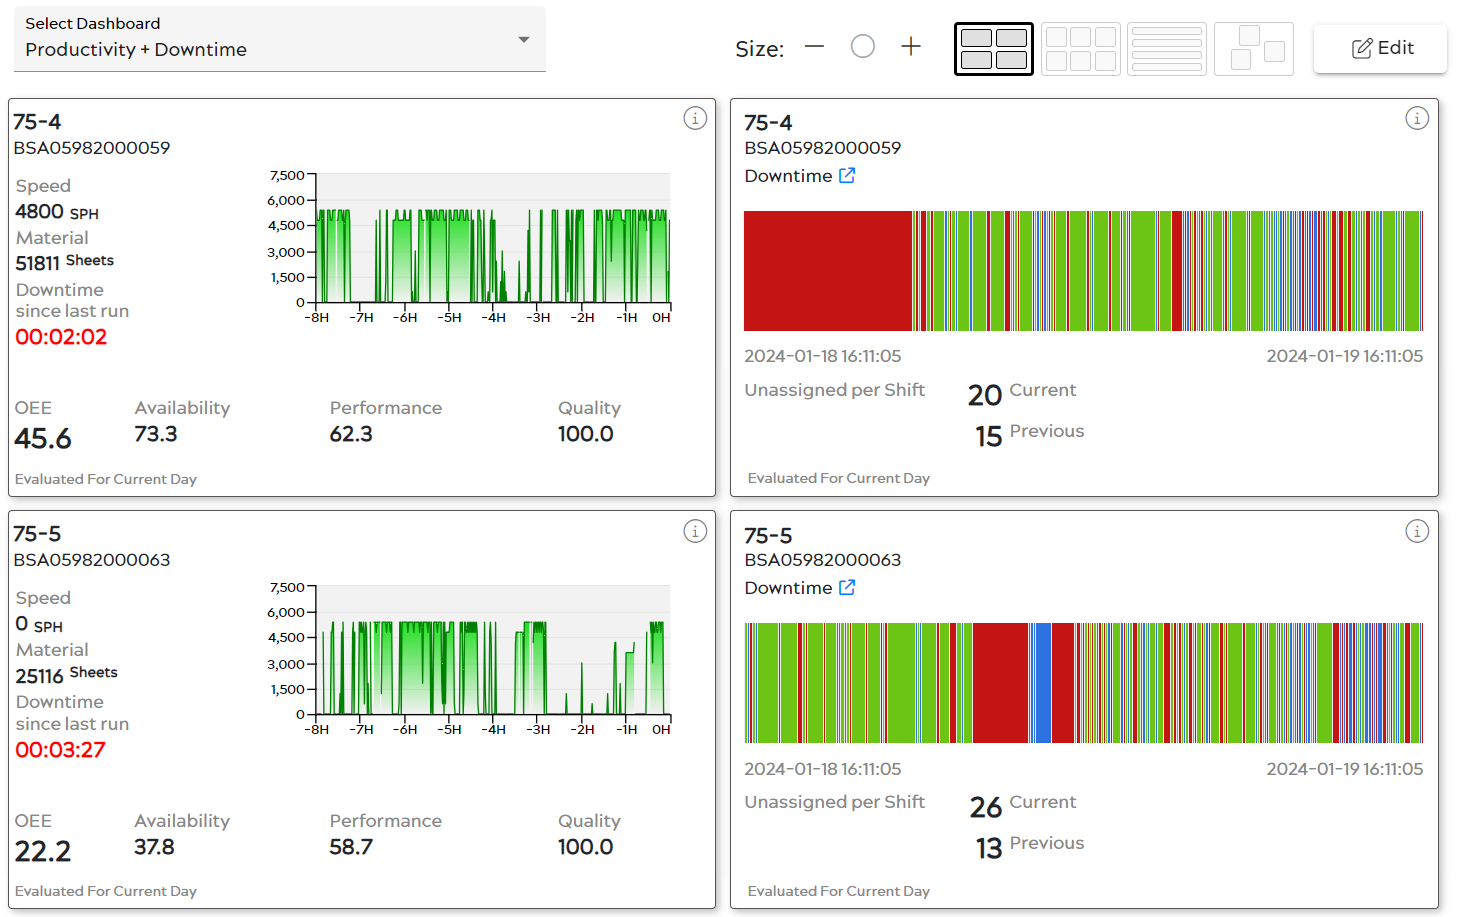
The large grid layout
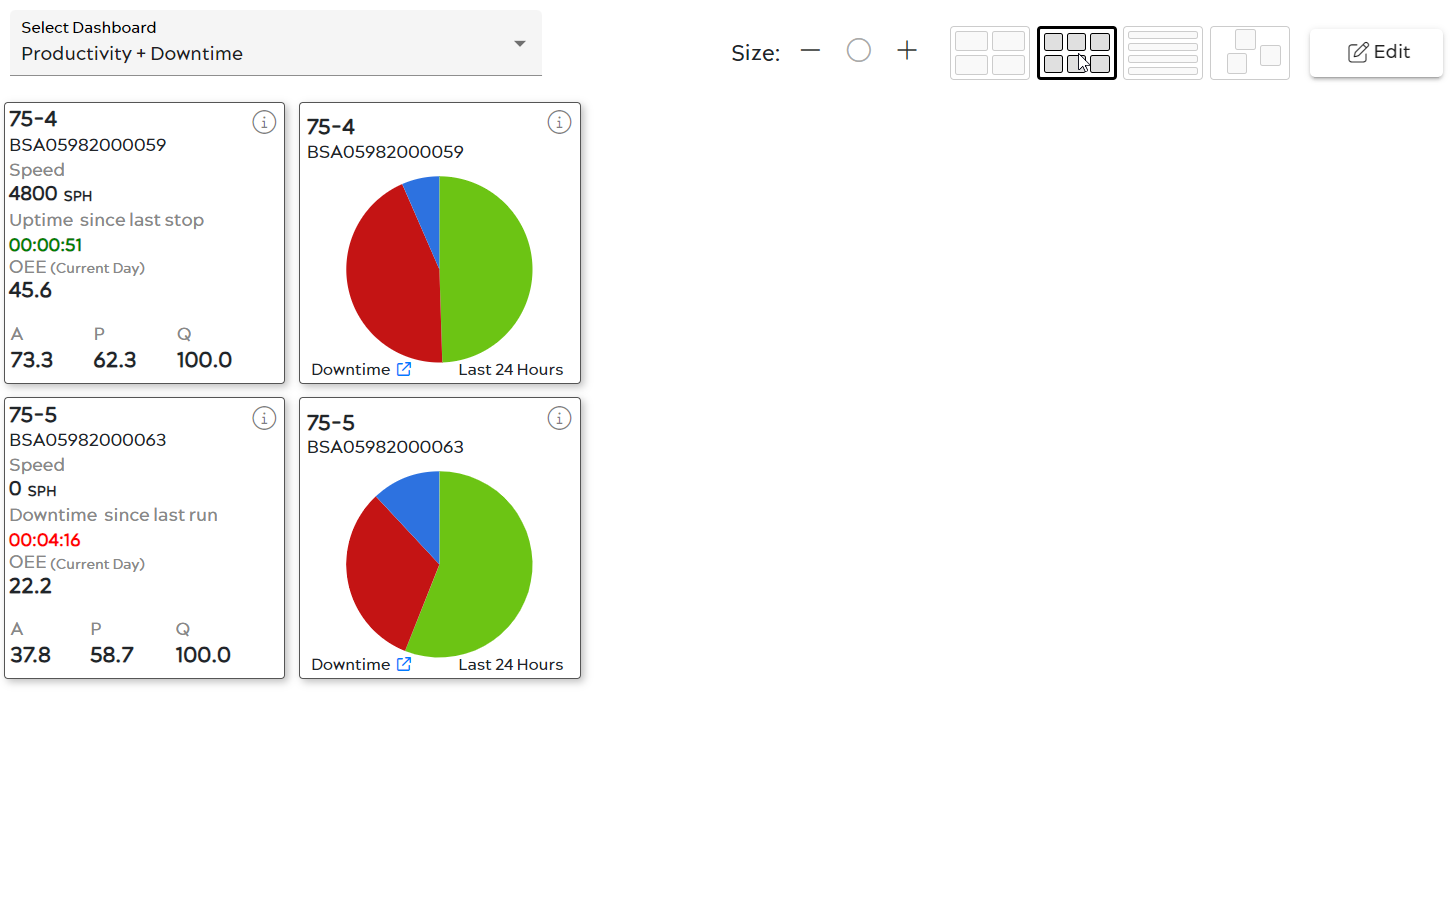
The small grid layout
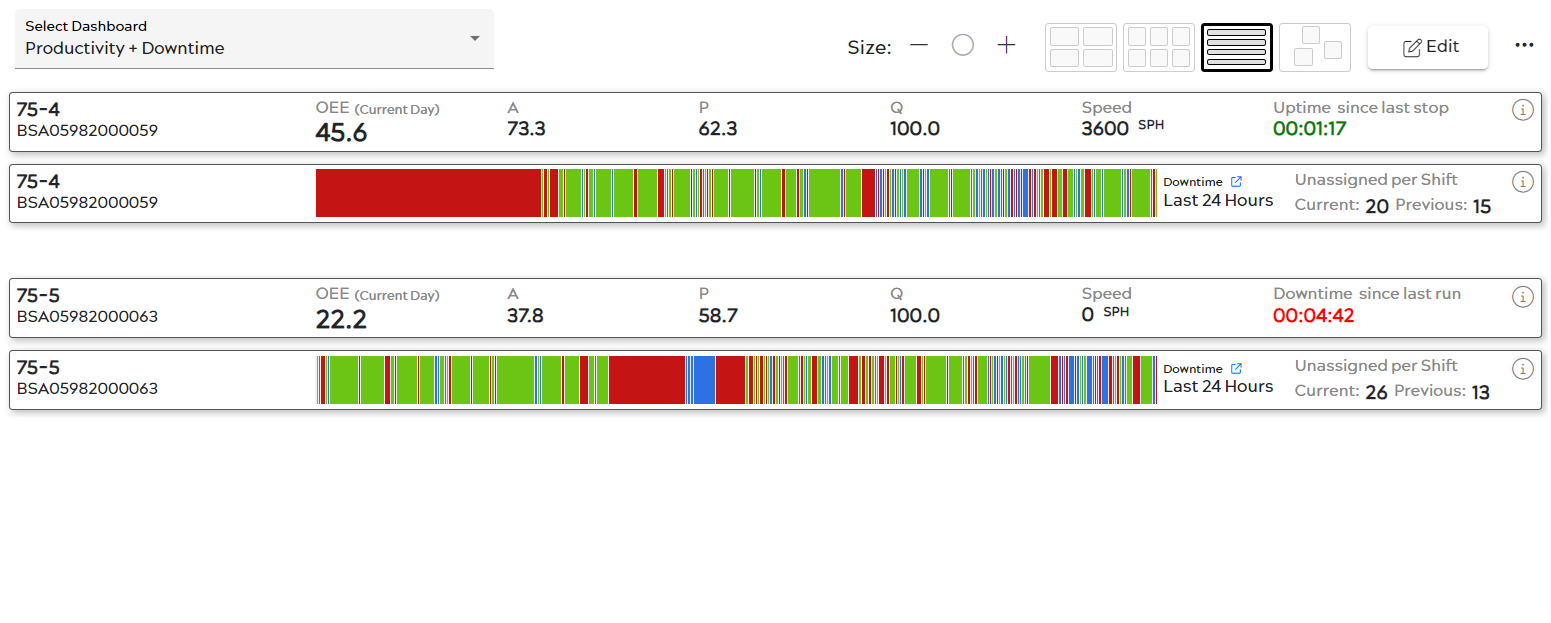
The table layout
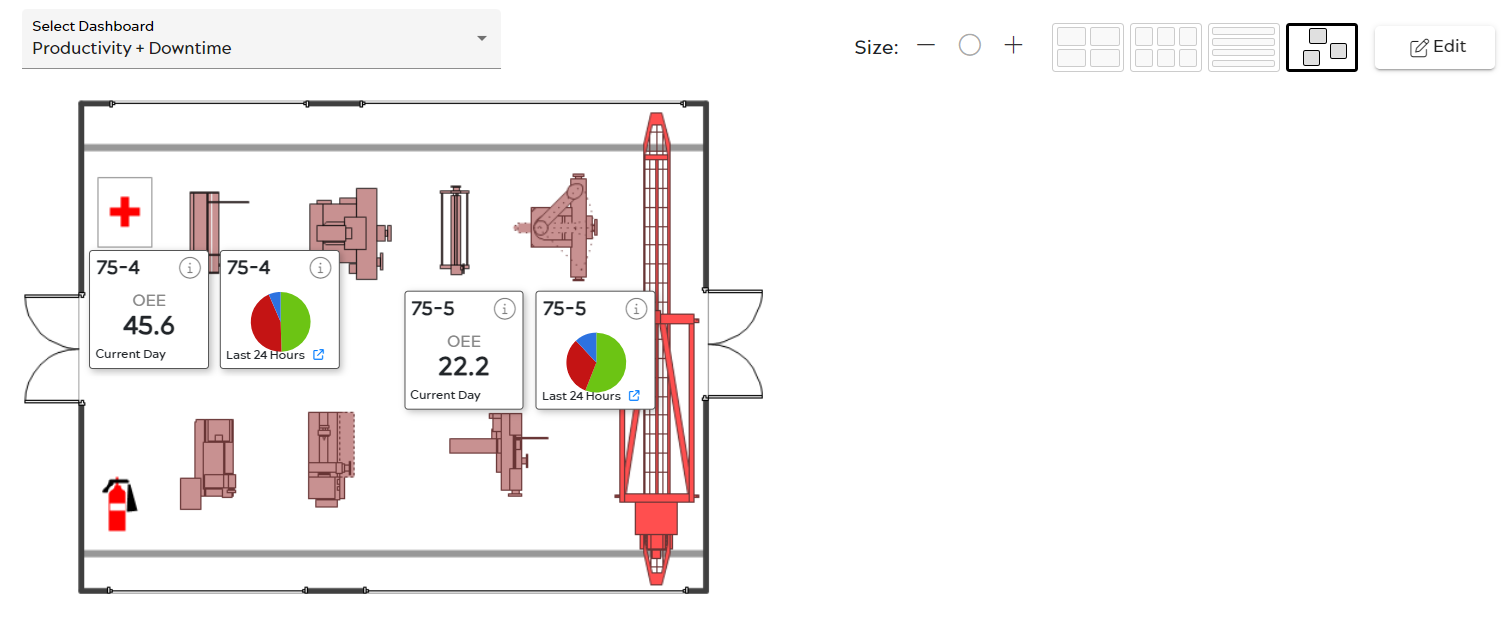
The factory layout
As you can see, all layouts include the same machines and the same badge types but those badges are presented in a different way. You can switch between them at will for any dashboard you define.
Badge Information
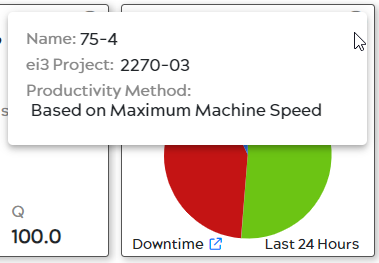
Every badge displayed on an INSIGHTS dashboard contains the (i) icon in the top-right corner. When you click this icon, a popup containing additional information will be displayed:
Badge Types
INSIGHTS Overview dashboards can include:
- Machine badges that display information about a specific machine. There are four types of general-purpose machine badges at the moment:
- Machine badges designed for specific types of machines:
- Line breaks that serve the same purpose as the line break character in a text editor.
Note: the availability of badges is dictated by the products enabled on the machine in question. For example, if the selected machine has no downtime tracking enabled, the Downtime badge will not be available for it.
Creating Dashboards
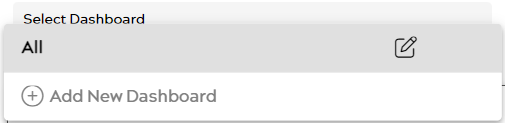
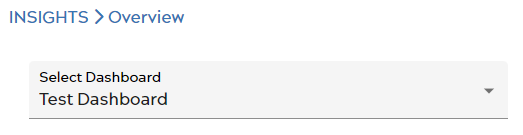
To manually create a new dashboard, click on the Select Dashboard dropdown on the top-left side of the INSIGHTS Overview page. A list of already created dashboards will be displayed, and at the bottom of it there will be the Create a Dashboard option:
When you click on Create a Dashboard, you will be presented with the Add Dashboard popup:
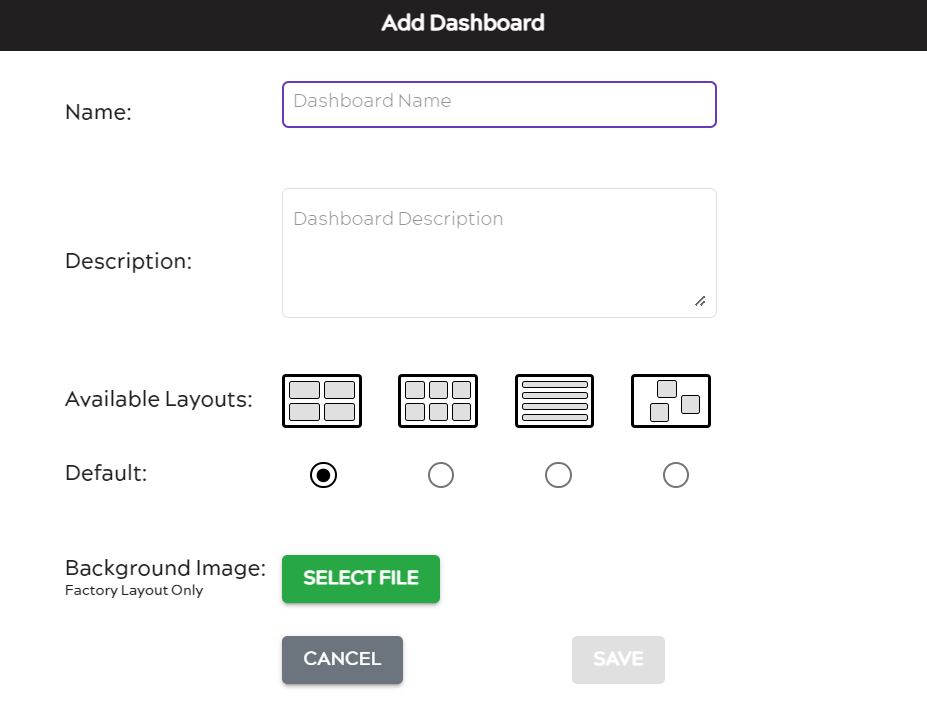
The following pieces of information can be provided when creating a new dashboard:
A name that will be displayed in the dropdown on the top-left of the Overview page; this entry is required.
A description.
Which layouts will be available in the View mode of the dashboard, and which one of them will be shown by default. This lets you explicitly design dashboards for various purposes and for various information density – and to only offer to your users the layouts that are suitable for the purpose.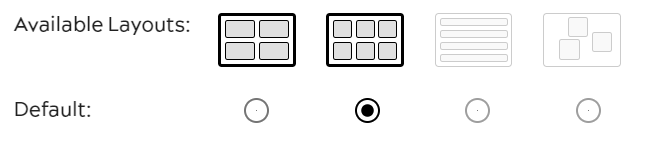
A background image that will be used when rendering the factory layout:
Once you click the Save button, the new dashboard you created will be automatically put in Edit mode and you will be able to add badges to it immediately; see the next section for more details.
Configuring Existing Dashboards
To change the configuration of an existing dashboard, first select it from the Select Dashboard dropdown. Then click the three dots icon on top right of the page (next to the Edit or Done button) and select Configure from the menu:

This action will bring up the same popup we discussed in the previous section – but it is titled Configure Dashboard:

Customizing Dashboards
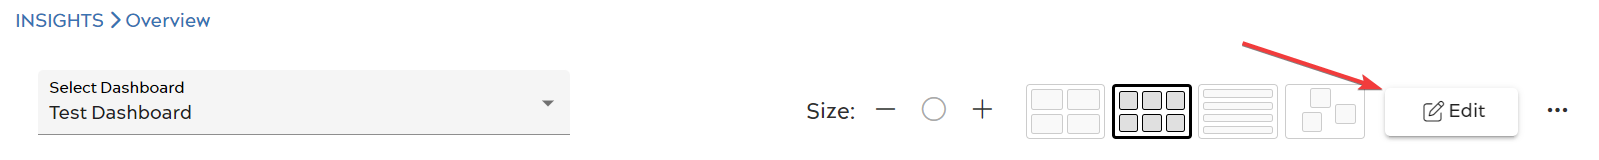
By default, dashboards displayed on the INSIGHTS Overview page are presented in the View mode. To make changes to them, you have to switch to the Edit mode by clicking the Edit button in the top-right corner of the page:
New dashboards are created in Edit mode – you can make changes to them right away.
Saving Dashboards
To exit the Edit mode and save your dashboard, click on the Done button in the top-right corner of the page.
Creating Badges
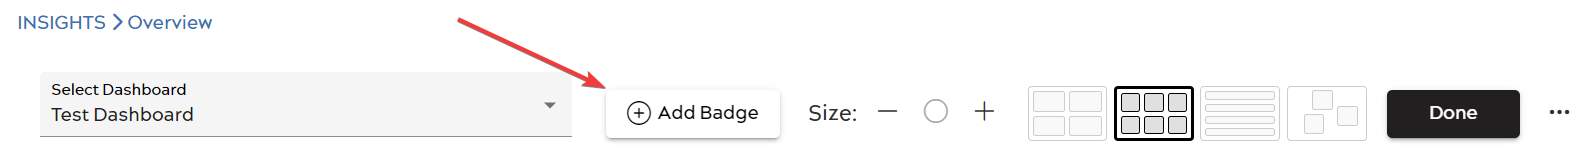
Once in Edit mode, click the Add Badge button to create a new badge:
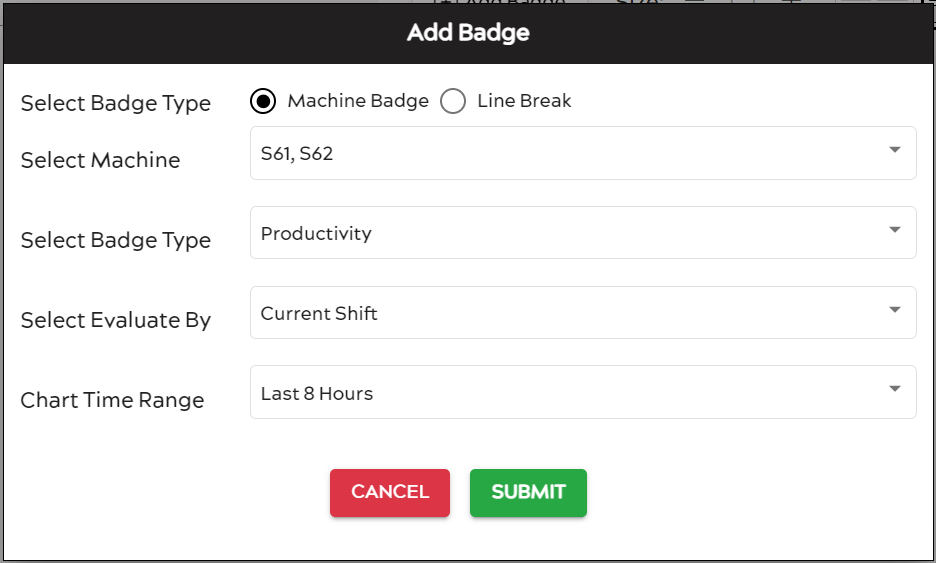
In the Add Badge popup, specify the badge type and the machine(s) – the latter, only for machine badges:

It is also possible to add a line break to the display, to aid with organizing the badges on your dashboard.
For machine badges, you will have to select:
- One or more machines.
- A specific type of visualization, also known as the badge type; the list of choices will depend on the products that are enabled on the selected machine.
- Additional fields that depend on the type of visualization selected, e.g. a time range.
Clicking the Submit button will add the configured badge to the dashboard, at the very end – after all the existing badges.
Selecting Machines
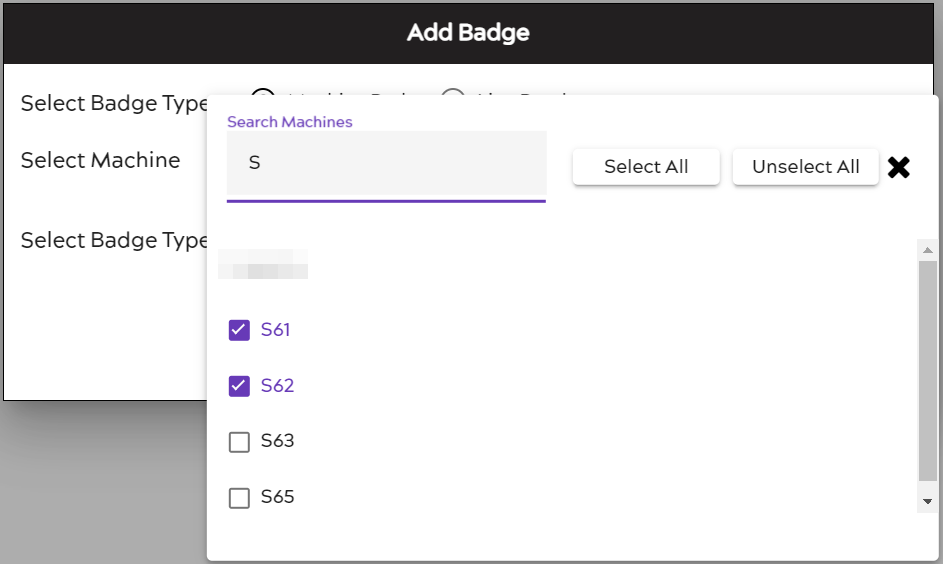
Clicking the Select Machine dropdown will display an advanced selection popup where you will be able to search for and select multiple machines. This option allows you to quickly create identically configured badges for any number of machines.
Note that if you select machines that have very different characteristics (e.g. some have downtime tracking enabled and some – don’t), your choice of visualizations and other subsequent settings will be limited because ei3 will attempt to find the most common denominator for the selected machines. For this reason, it is best to only select machines of a similar type together when creating multiple badges at a time.
Undoing Changes
Use the Undo button at the top-left of the page to undo changes made to the dashboard.

Organizing Badges
Note: to switch between the Edit and View modes, please click the Edit or Done buttons in the top-right corner of the INSIGHTS Overview page.
While in the Edit mode, the created badges can be modified and reorganized using the small icons located in the top-right corner of each badge:
The “i” icon displays additional information about the machine when you hover your mouse over it:
If there are any active Alert push notifications that you are a recipient of, you will see them on the machine’s badge, along with the icon that will bring you to the Alert Center to view more information about the Alert. To learn more about this feature, please visit this article: Viewing Alerts Via INSIGHTS Badges . The figure below shows what pressing on “i” icon will appear as if you have an Alert.

The pencil icon displays the Edit Badge popup where you will be able to modify the machine, the badge type, and other parameters of the badge – just as when you created the badge.
The icon with four arrows allows you to drag the badge to a different location on the dashboard.
Finally, the “x” icon will remove the badge from the dashboard.
Line break badges can only be moved and deleted – they don’t have any other configuration options. Note that, in Edit mode, line break badges are displayed as thick, gray, dashed lines; those lines are not visible in the View mode of the dashboard.
Sharing Dashboards
Currently, every user creates Overview dashboards for their own use only; in other words, dashboards cannot be shared among users. ei3 is planning to add dashboard sharing functionality in a later release.
Deleting Dashboards
To delete an existing dashboard, you have to first select it using the Select Dashboard dropdown:
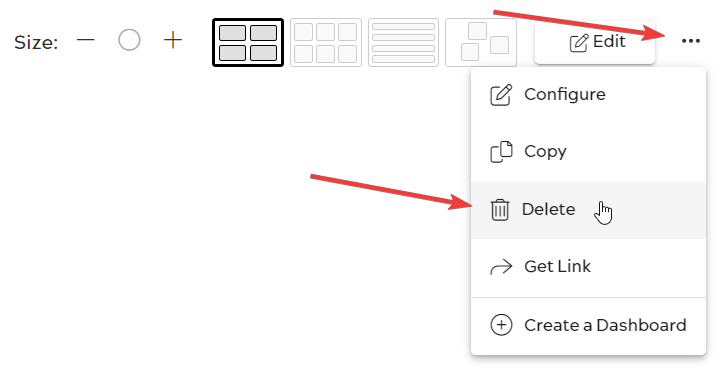
Then, click the three dots icon on top right of the page (next to the Edit or Done button) and select Delete from the menu:
You can also delete the dashboard when the Configure Dashboard popup is visible – by clicking the red DELETE button.
Note: the action of deleting a dashboard cannot be undone.
Other Options
When you click the three dots icon on top right of the page (next to the Edit or Done button), a menu appears.
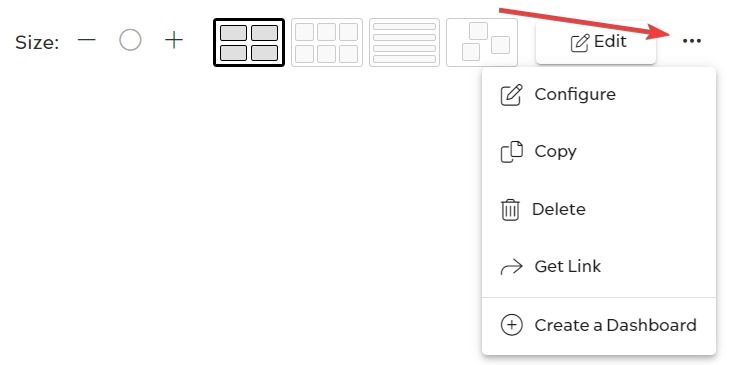
We discussed two of the options in this menu (Configure and Delete) previously in this article.
The Copy option creates a copy of the current dashboard. This can be particularly useful if you wish to use the dashboard you are currently viewing as a starting point for another dashboard while keeping the original one intact.
The Get Link option generates a link (URL) that can be used to view the current dashboard as a separate display, outside of the ei3 web portal.
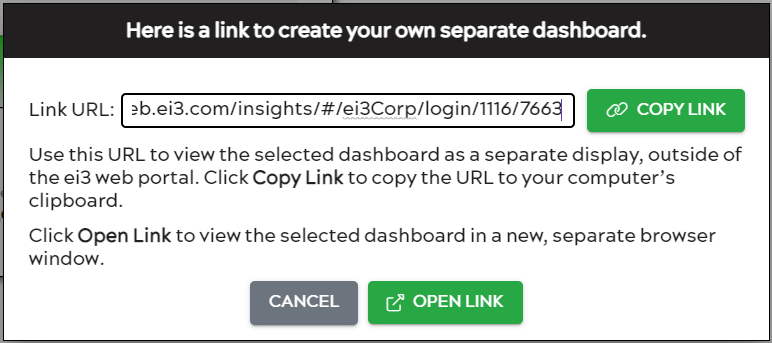
When you navigate to the provided URL, you will be greeted by a login page where you will have to enter your ei3 credentials. Then, you will see the exact copy of your dashboard but without the option to modify it or to access any other ei3 functionality. This makes this feature perfectly suited for trade shows, factory floor displays and similar use cases.
Other Ways to Monitor
Using the Tracker or by downloading one of the machine tracking apps for your mobile device, it is possible to monitor a machine on the go or outside of the workplace.
