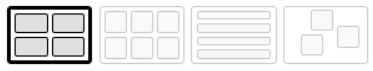
This article describes the Data Point badges available in dashboards that are displayed on the INSIGHTS Overview page in ei3. The badges display the information for any data point you choose to see for your machine including the data point name, current value, and even graphs which you can set for many different time ranges. You can switch between the layouts using the following toggle, located in the top-right corner of the Overview page:
Keep reading to learn more about the different types of Data Point badges!
How to Create a Data Point Badge
On the INSIGHTS Overview page, first select the Edit button ![]() in the top right corner, then the Add Badge button
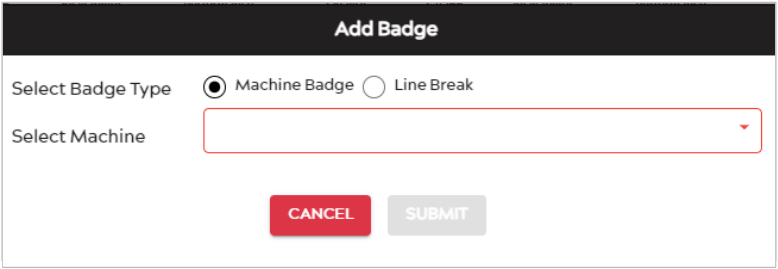
in the top right corner, then the Add Badge button ![]() . A window like the one below will appear, where you can select the machine you wish to add a badge for using the dropdown menu.
. A window like the one below will appear, where you can select the machine you wish to add a badge for using the dropdown menu.
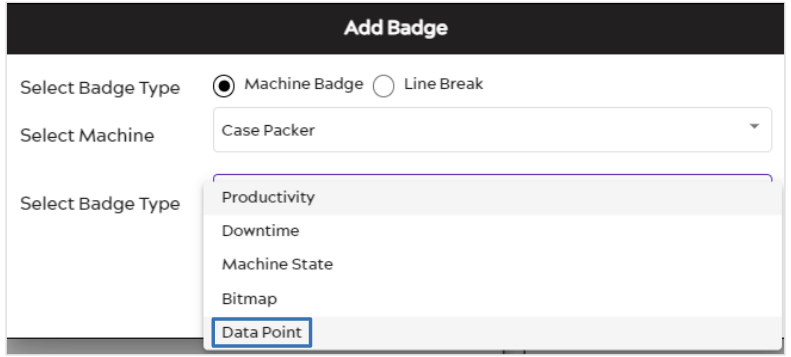
After selecting the machine you wish to use, another dropdown menu will appear, where you can select the Badge Type. Select “Data Point”.
After selecting Data Point, two more dropdown menus will appear where you can select what Data Points you wish to include for your badge, you would like the Chart Time Range to be (Past 15 or 30 minutes, Last 4, 8, 12, or 24 hours, or Current Shift). The selectable data points depend on the points that we are reading from your machine, which may include Good Material, Total Material, Target Speeds or Machine Speeds. When you’re done, press the Submit button ![]() for your Data Point badge to appear on the Dashboard.
for your Data Point badge to appear on the Dashboard.![]()
Please note that for each data point chosen under the Data Point dropdown, a badge will appear for it. So, if you select more than one data point under the Data Point dropdown, more than one badge will appear on your Dashboard.
Data Point Badge Types
Large Badge
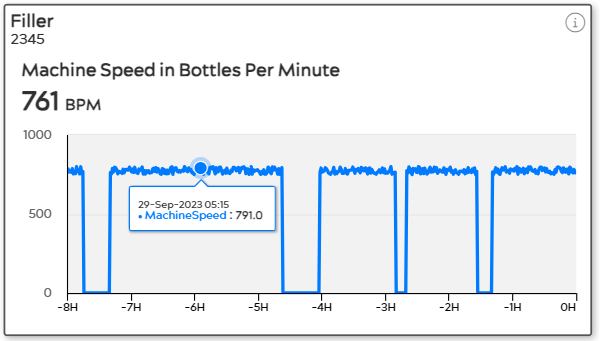
In the example below, a Data Point badge was created for a machine, tracking the “Machine Speed in Bottles Per Minute”, for the past 8 hours. It is in the Large Badge format.
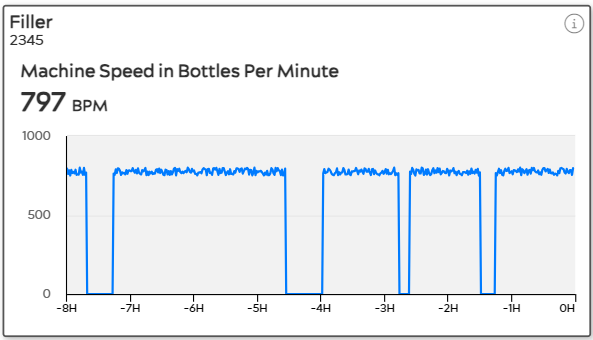
As seen above, the Data Point Large badge format displays the machine name, data point being tracked, the current value for the data point, and a graph with time on the x-axis and Bottles Per Minute (BPM) on the y-axis. Note that the units for the y-axis will vary depending on the chosen data point, and that BPM is just an example for this data point.
Hovering over the graph will display useful information about the data point at any given time during the Chart Time Range. As you hover over the graph, a Blue circle will appear on the graph where your mouse is and will then display below the Date, Time, and Data Point Name & Value.
Small Badge
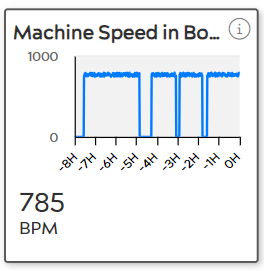
The Data Point Small Badge shows essentially the same information as the Large Badge but in a condensed version. The Small Badge does not include the Machine Name, but the Graphs are the same and show the same information when hovering over them, and it still says the Data Point Name (truncated if too long)and current value.
Table Layout Badge

The Data Point Table Layout badge contains all the information as the Large Badge but in a thin bar. The graphic on it is the exact same as that of the Large and Small badge graphs except it has no legend or axis. Hovering over the graphic will display the same information as the Large and Small badges.
Factory Layout Badge
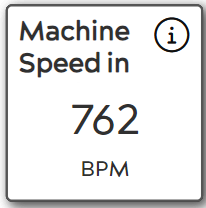
The Factory Layout badge for Data Points simply shows the name and current value of that data point. This is the most simple badge and is useful if you do not need to see the graph.
