This feature requires Monitor to be an active product on your machine.
The Compare function allows users to create a ‘fingerprint’ of their machines by saving the data from a selected time period a to create a baseline data set from existing machine data, for statistical comparison with data from other time periods. The function provides a comparative analysis of machine performance over time and can be found under MONITOR > Compare.
- Compare – Actions
- Creating a New Baseline Data Set and Running a Baseline Statistical Analysis
- Comparison Analysis of Baseline with a Different Time Period
- Compare Test Data Set from Different Time Period with Baseline
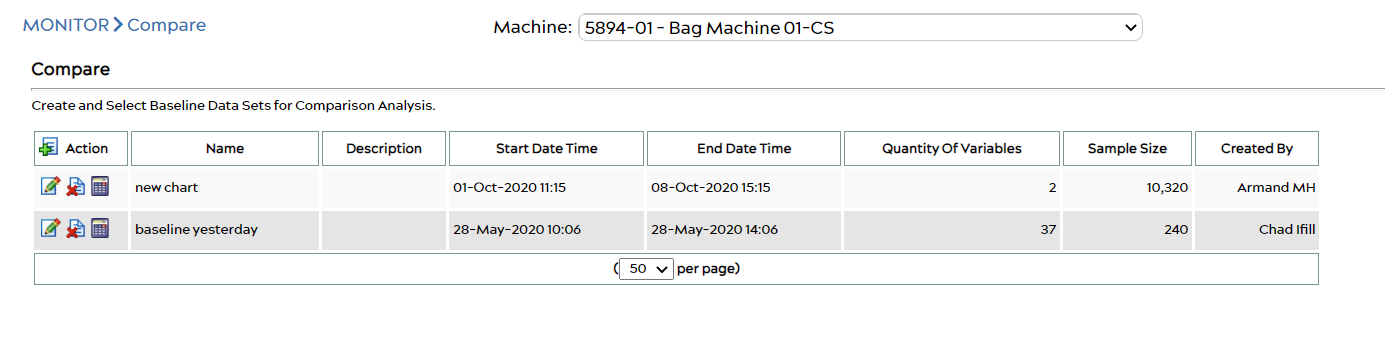
Compare – Actions
![]() – Create a new baseline data set against which you can statistically compare a data set from a different time period (i.e. a test or reference data set).
– Create a new baseline data set against which you can statistically compare a data set from a different time period (i.e. a test or reference data set).
![]() – Edit an existing baseline data set by changing the name, time period or selected variables of a data set. Note: only the user who created a baseline data set can perform this action.
– Edit an existing baseline data set by changing the name, time period or selected variables of a data set. Note: only the user who created a baseline data set can perform this action.
![]() – Delete a baseline data set.
– Delete a baseline data set.
![]() – Perform a statistical comparison of the selected baseline period against a test data set to be defined from a different time period.
– Perform a statistical comparison of the selected baseline period against a test data set to be defined from a different time period.
Creating a New Baseline Data Set and Running a Baseline Statistical Analysis
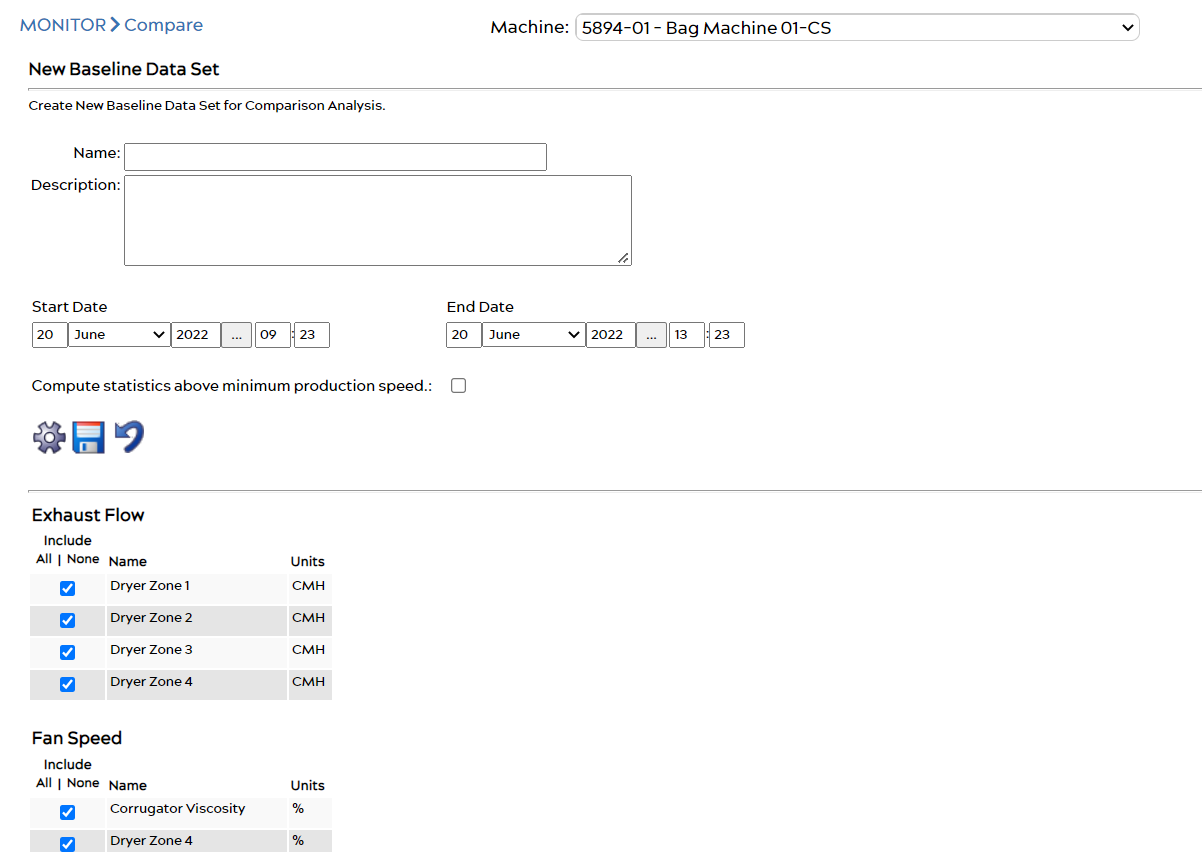
- Select the desired machine from the drop-down selection menu at the top of the page.
- Enter a name and description for your baseline data set.
- Choose a start date and time, and an end date and time for your machine baseline data. You can use the calendar data selection tool by clicking on the
 symbol.
 - Check or un-check the box Compute statistics above minimum production speed. This will enable or disable the feature when creating your baseline, respectively.
- Check or un-check each data variable (data point) from the selected machine which you would like to have included in the baseline.
- Click Calculate
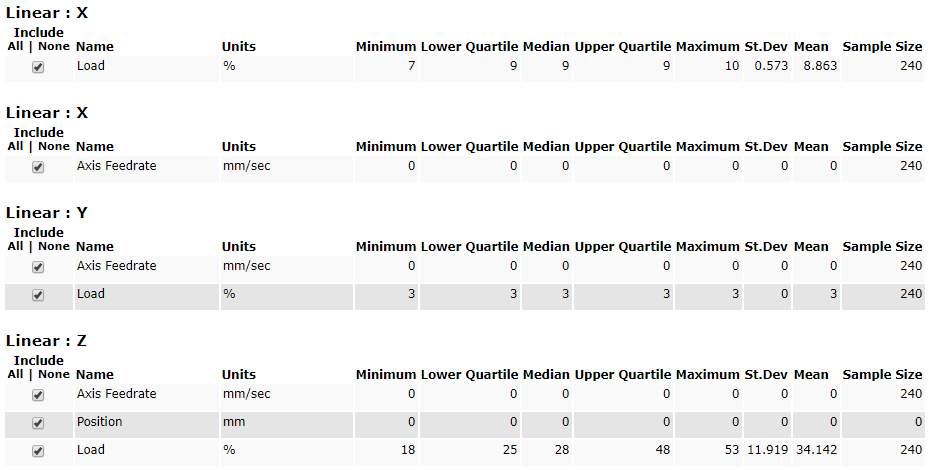
 to generate statistical baseline analysis values for each of the selected data points (a confirmation window may appear, click OK). The page will re-load to populate with the results of the statistical analysis of each point in the baseline data set.
 - Clicking Save will save the baseline data set, and take you back to the main Compare page where the saved item will appear in a list along with other saved baselines on the selected machine.
- You can click the back arrow to cancel without saving any changes or results.
After clicking Calculate, each selected code will include each of the following values:
Comparison Analysis of Baseline with a Different Time Period
After a baseline data set has been saved, you can use it to compare against machine data from another time period. Click the Select Time Period for Comparison icon to get started.
Input a start and end date and time for your desired comparison test period. You can use the provided calendar tool to select a date by clicking the ![]() icon.
icon.
![]() – View selected data set comparison analysis results, from the time period selected.
– View selected data set comparison analysis results, from the time period selected.
![]() – Download the data set comparison analysis report to your computer as a PDF file.
– Download the data set comparison analysis report to your computer as a PDF file.
![]() – Cancel the request and take you back to the main Compare menu.
– Cancel the request and take you back to the main Compare menu.
Compare Test Data Set from Different Time Period with Baseline
All data set comparison results are displayed with a box-whisker plot of the baseline data side-by-side with the test period data. The line across the inside of the box is the median value. You will always see the baseline values in a table listed above the test values, alongside the graph for each plotted data point.
