Note: This alert function requires MONITOR to be active on the machine.
MONITOR Alerts is a feature of ei3 that lets users configure custom notifications based on conditions related to machine data, for example if a data point’s value reaches a threshold, if a data point’s value is missing, or if there is a data gap for the entire machine or for a single device. See Use Cases for more details.
Once configured, MONITOR alerts are sent out via text message (SMS), email or mobile notification whenever the parameters of your alert have been reached.
This functionality can be found in the Customer Portal in MONITOR > Alerts.
Use Cases
There are two types of MONITOR alerts that can be configured: Data Gap alerts and Data Threshold Limits alerts. Each of these can then be further tuned to fit specific scenarios.
Data Gap Alerts
A gap in data can occur when a machine cannot connect to the internet, so its data cannot get to ei3.
A Data Gap alert can be set up for your machine(s) to notify you whenever a gap in data occurs according to the alert parameters that you set. A gap of 10 minutes or more may be defined for each alert set up.
A Data Gap alert only triggers when all data for a given machine becomes unavailable. When multiple devices used for data collection are connected to your machine, this means that data is not being collected from all those devices. If you wish to configure an alert when a data gap occurs only for a specific device, please use a Data Threshold Limit alert – see below for a description of this use case.
Data Threshold Limits Alerts
Data Threshold Limits alerts are not defined for the machine as a whole; instead, they are defined for one or more specific data points. There are two broad categories of such alerts:
- Valid data point values are compared to thresholds.
- Data point values can or cannot be retrieved from the device.
Alert Actions
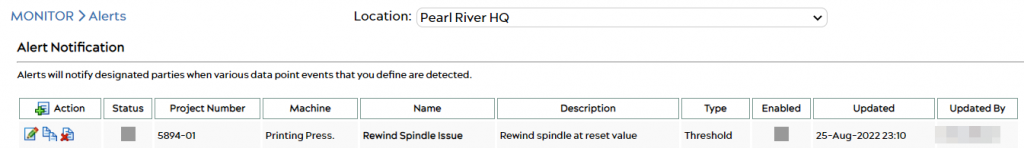
Once an alert has been created, it will display on the main MONITOR > Alerts page in a list.
The symbols in the Action column provide the following functions:
 Create a new alert. See Creating Alerts below for more information.
![]() Edit an existing alert.
Edit an existing alert.![]() Copy an alert.
Copy an alert.![]() Delete an alert.
Delete an alert.
The Enabled column displays whether the alert is enabled or disabled. A green icon ![]() signifies that the alert is enabled. A gray square
signifies that the alert is enabled. A gray square  signifies that the alert is disabled. To enable or disable an alert, see Alerts – Basic Information.
The Status column indicates whether or not the alert is presently in an “active” state, i.e. if the conditions have been met and the alert has been triggered. A red icon ![]() signifies that the alert is currently active. A gray square signifies that the alert is not active at the moment. See Alert Status Information for details.
signifies that the alert is currently active. A gray square signifies that the alert is not active at the moment. See Alert Status Information for details.
Creating & Editing Alerts
In the Customer Portal, navigate to the MONITOR > Alerts page, and select the New ![]() icon under the Action column to open the Add Alert Notification page.
icon under the Action column to open the Add Alert Notification page.
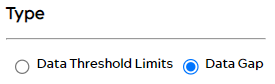
Alert Type
Choose either the Data Threshold Limits or Data Gap option from the radio buttons shown. Depending on your needs
- Data Threshold Limit: If the user wants to get alerted when one or more specific data points do not meet certain conditions / limits. See Data Points for more information.
- Data Gap: Not specific to data points; applicable to all data collected from the machine.
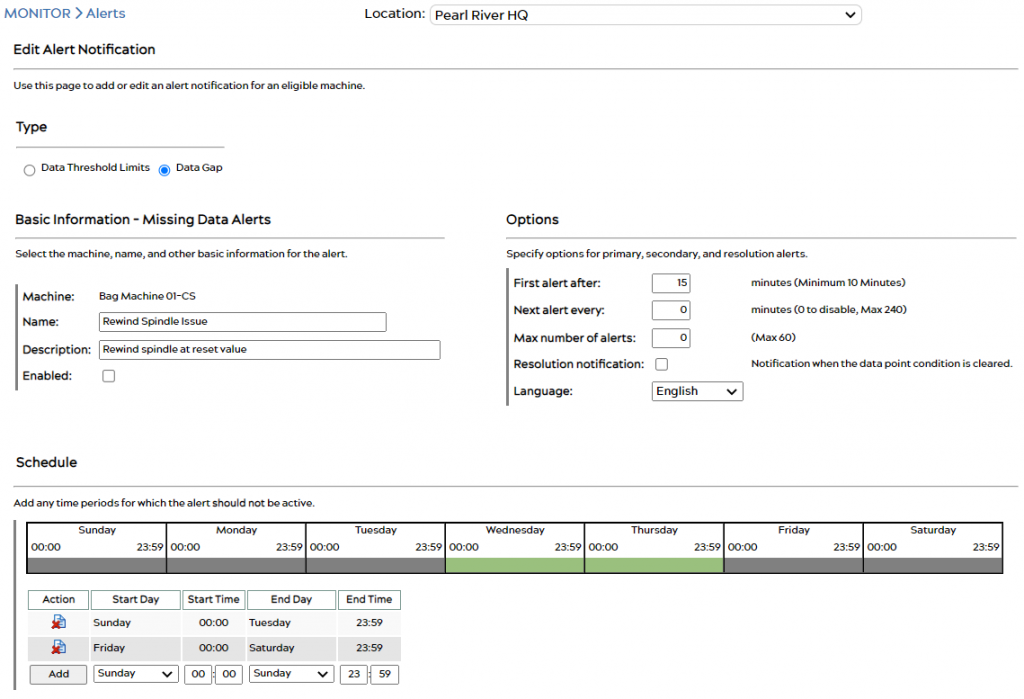
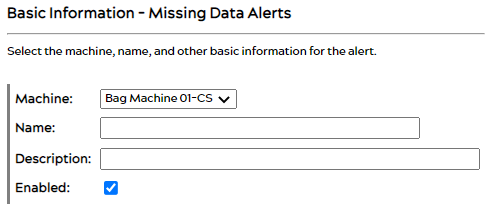
Basic Information
Enter the alert’s name and description, select a machine, and choose to enable or disable the alert.
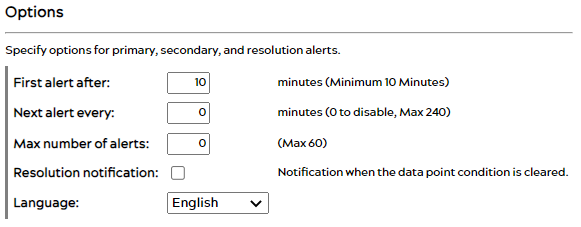
Options
Users can specify alert options – alert frequency, number of alerts, language, and more.
Data Gap alerts must have a delay (First alert after) of at least 10 minutes – see the screenshot below. Data Threshold Limits alerts can have the delay as short as one minute.
Data Points
This section will only appear if you select Data Threshold Limits at the top of the page.
The two radio buttons: any and all let you control how multiple conditions will be combined by ei3. Hover your mouse over the Info ![]() icon to see a few examples.
icon to see a few examples.
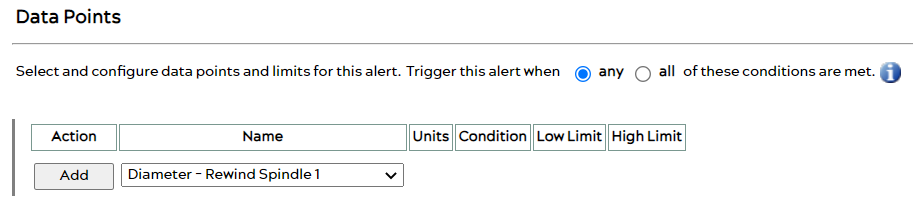
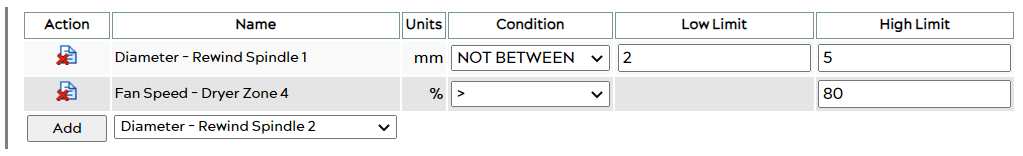
Select a data point from the drop down menu in the Name column and click Add. Then, specify the conditions for the data point. You will have a choice of:
- BETWEEN and NOT BETWEEN for checking if the values lie inside or outside of a specific band.
- >, >=, < and <= for checking if the values are greater than or lower than a specific threshold.
- NULL and NOT NULL for checking if the data point is (or is not) being read from the device. These conditions are helpful when trying to detect data gaps on specific devices – not from the machine as a whole.
- CHANGING and UNCHANGING for checking if the value of the data point is changing (or not) over time. These conditions are helpful to detect changes to data points that are generally expected to have very stable values or that indicate machine state.
The screenshot below shows how multiple conditions can be combined to produce a very fine-grained notification.
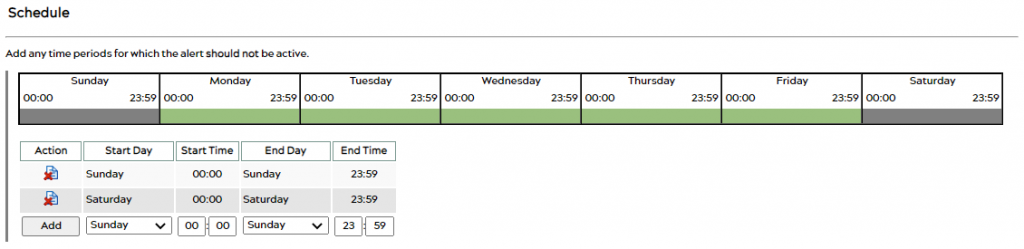
Alert Schedule
Choose a time period during which alerts should be sent out. For instance, if a machine runs only five days a week and alerts should not be sent out on weekends, configure the Schedule section to match the machine’s run times.
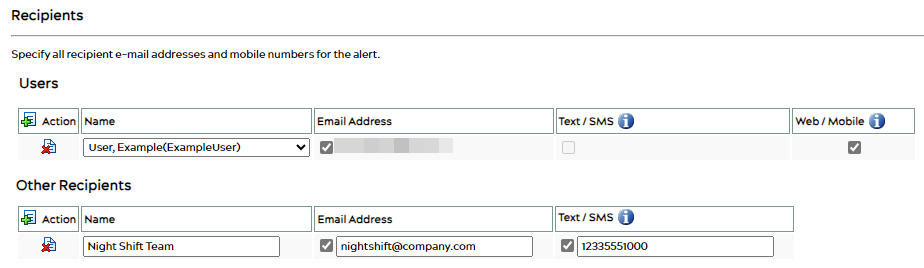
Recipients
Add alert recipients in the Recipients section. Email, SMS / text and web / mobile alerts are supported; text messaging fees may apply.