Charts – Process Data
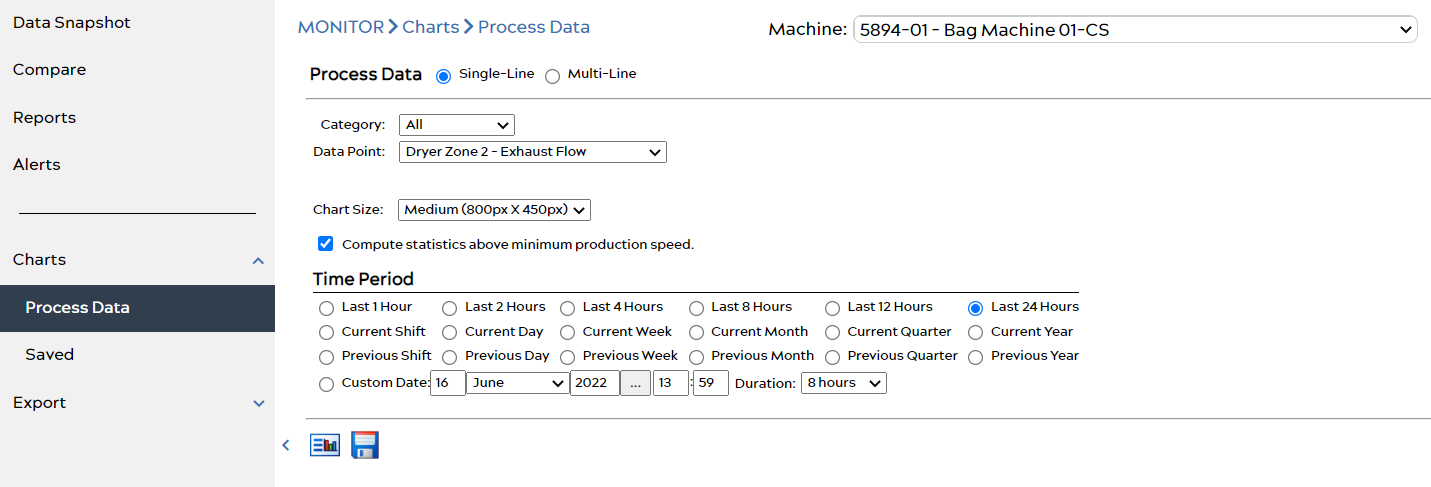
From the MONITOR menu, selecting the Charts > Process Data tab will open machine variables including material production, speeds, and temperatures can be tracked individually from the charts in this section. Users have the option of using a Single Line chart or a Multi-Line chart. The other key feature of Process Data chart is the ability to choose an interactive charting mode.
After selecting a category and data point, and choosing time parameters if desired, press the ![]() icon to view the chart. Hovering over the displayed line graph will display values.
icon to view the chart. Hovering over the displayed line graph will display values.
Toggle auto-refresh using the ![]() icon (when active, chart refreshes once per minute).
icon (when active, chart refreshes once per minute).
Save currently displayed chart settings for easy access by pressing the save icon (saved charts will be listed under the Saved menu item below Process Data).
Choosing the Single Line option will track a single variable, as well as statistical information. On the other hand, choosing Multi-Line allows for tracking up to six different variables at once, and will also display statistics.
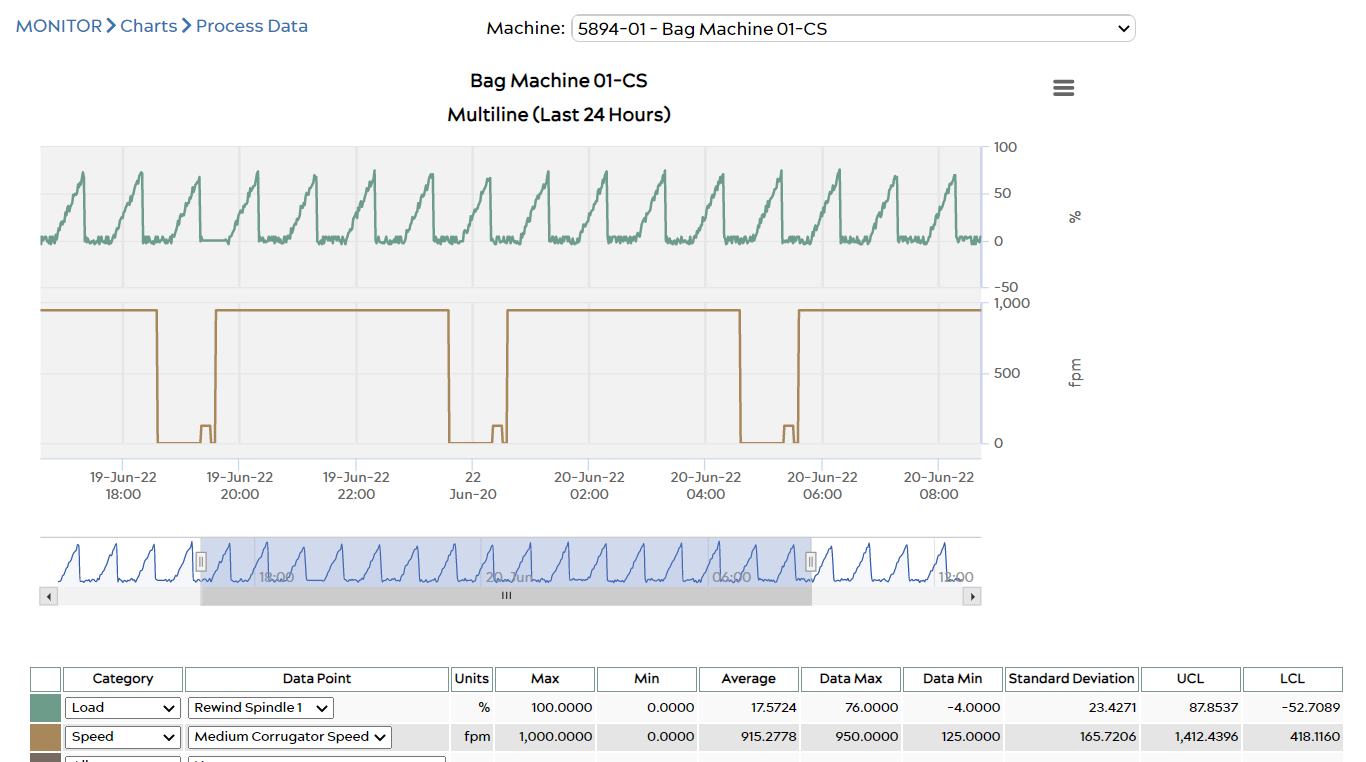
Generating a Static chart will provide a simple line graph; while choosing Interactive will create a graph with additional features – users can zoom in on a specific time interval by holding the left mouse button and highlighting an area, view precise data for a specific value by hovering over a point on the chart, scroll the x –axes and y-axes.
The Isolated Graphing option will display each line in a multi-line graph separately from each other rather than having them overlap.
Note: Isolated graphing is only available with Multi-Line charts and can be used in conjunction with Static or Interactive charting.
Export Data
Use the Export Data function to create Excel or CSV files containing machine data, to share and analyze as needed. You can read more about what’s included in these data exports here.
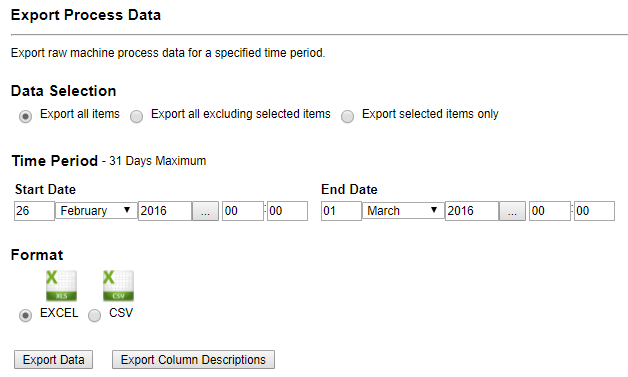
To export, from the Export tab, select a mode to summarize by and choose a desired start and end date for your preferred time period, then export in your desired format. Generates a downloadable file showing each collected data point on the selected machine, minute-by-minute, for the selected time period.
You can select specific points to include or exclude by using the radio button selection items displayed.
Saving Charts
After generating a chart, the user can save it to the system or export it if desired. To save a chart to the system, click the Save button under the chart just created, which is located under the process data section.
