The INSIGHTS Overview dashboard provides a visual representation of data, allowing users to gain key insights and better understand their operations. These dashboards can be customized with various badge types and layouts.
1. Access the Default Dashboard
Login to ei3 and you will see the INSIGHTS Overview page. The default dashboard called “All” will be displayed, showing productivity badges for eligible machines at the location. Following this guide, you will be able to customize or create new dashboards.
Layouts: The INSIGHTS Overview dashboards offer four different layouts.
- Large grid layout: Similar to the previous dashboard display, suitable for productivity badges.
- Small grid layout: More condensed version of the large grid layout, displaying smaller badges for higher density.
- Table layout: Badges are presented as slim rectangular lines, suitable for higher density displays.
- Factory layout: Square badges overlaid on a background image to visualize the factory or manufacturing process.
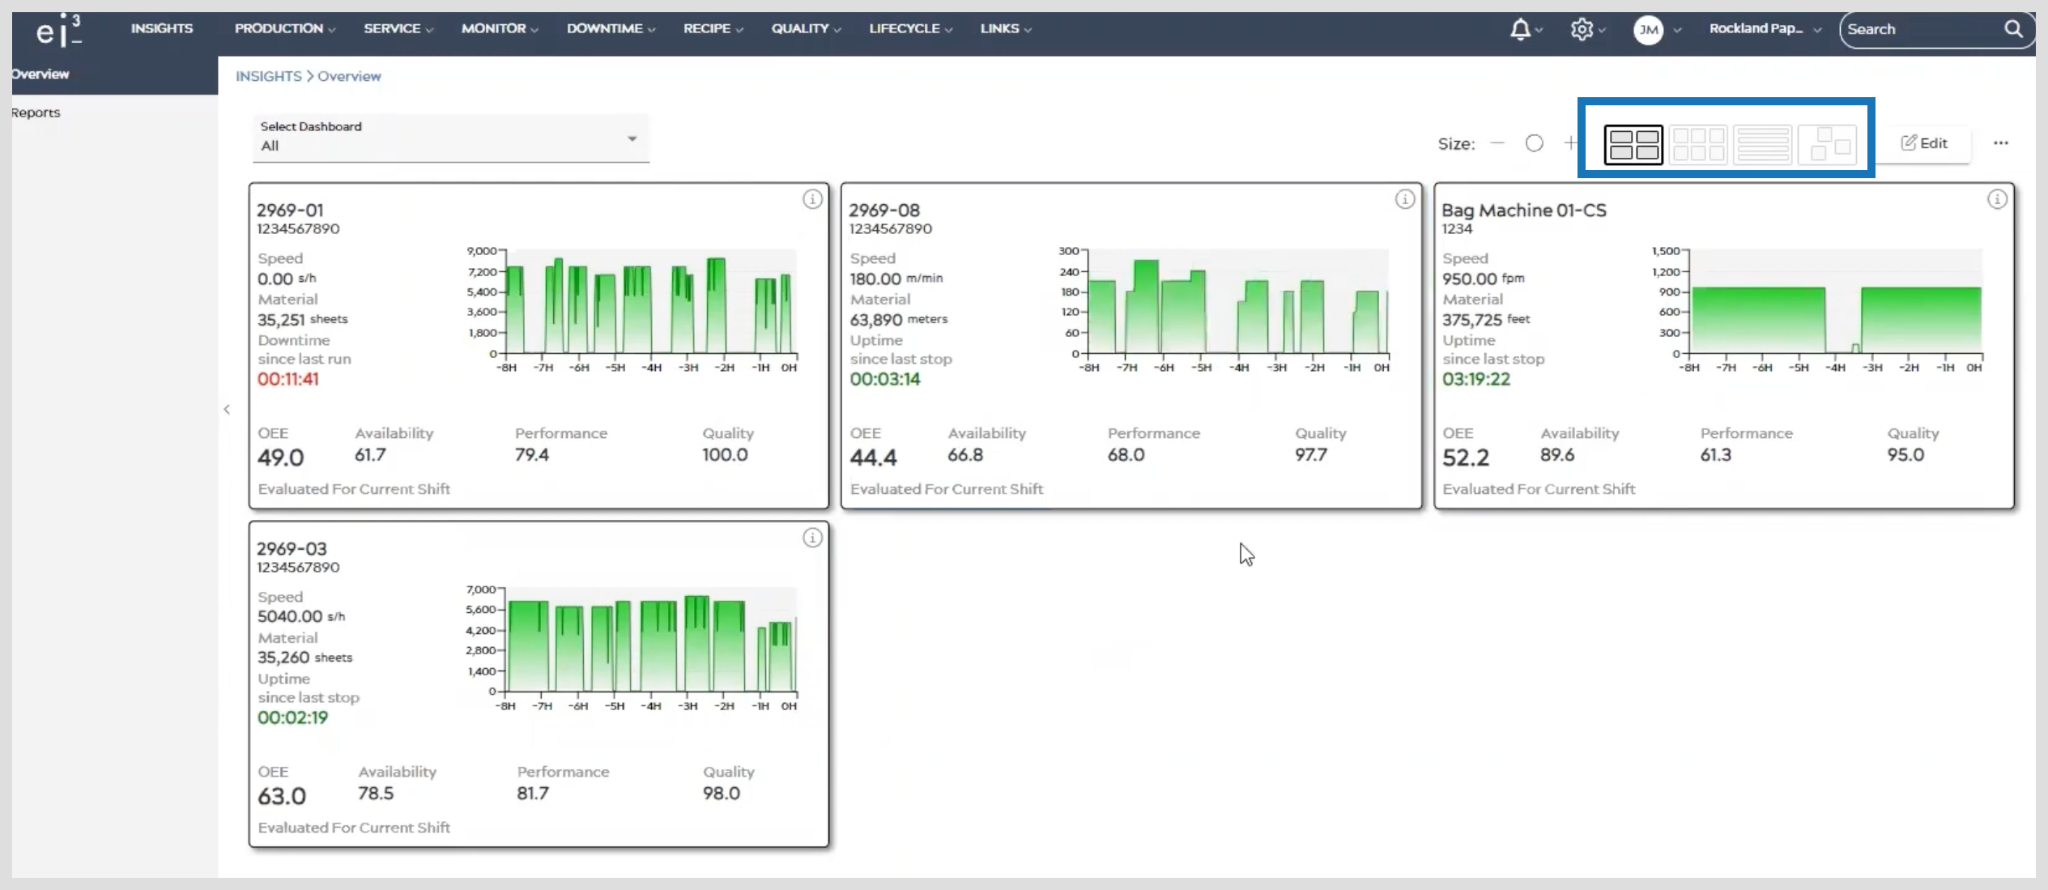
Switch between layouts using the toggle in the top-right corner of the Overview page.
Badge Types: INSIGHTS Overview dashboards can include various badge types.
- Productivity badges: Provide insights into overall equipment effectiveness (OEE) and productivity.
- Downtime badges: Track and display machine downtime information.
- Machine state badges: Show the current state of a machine.
- Data point badges: Display the information for any of the machine’s data points.
- Cycle time badges: Display the following information for a selected machine: current and average cycle time, machine up/down status and time, current job, and status of Lifecycle maintenance and predictions
- SUSTAIN badges: Show information about energy consumption and carbon emissions for a machine
2. Create your Dashboard:
- Click on the Select Dashboard dropdown on the top-left side of the INSIGHTS Overview page.
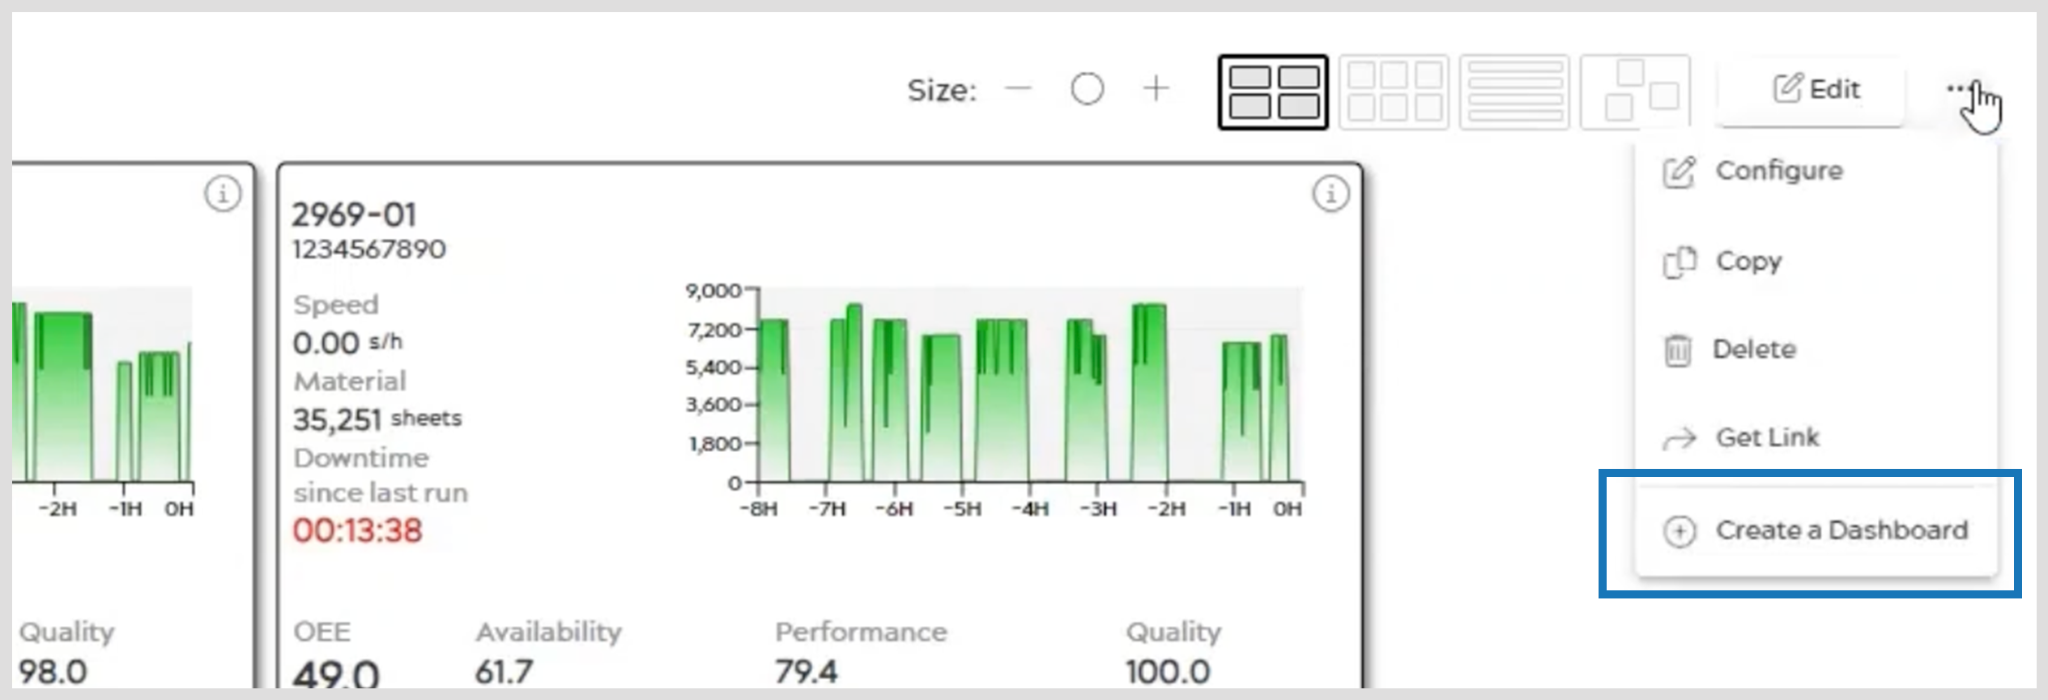
- Choose Create a Dashboard at the bottom of the list.
- In the “Add Dashboard” popup, provide a Name and Description for the new dashboard.
- Select the available layouts for viewing and choose the default layout.
- Optionally, set a background image for the factory layout.
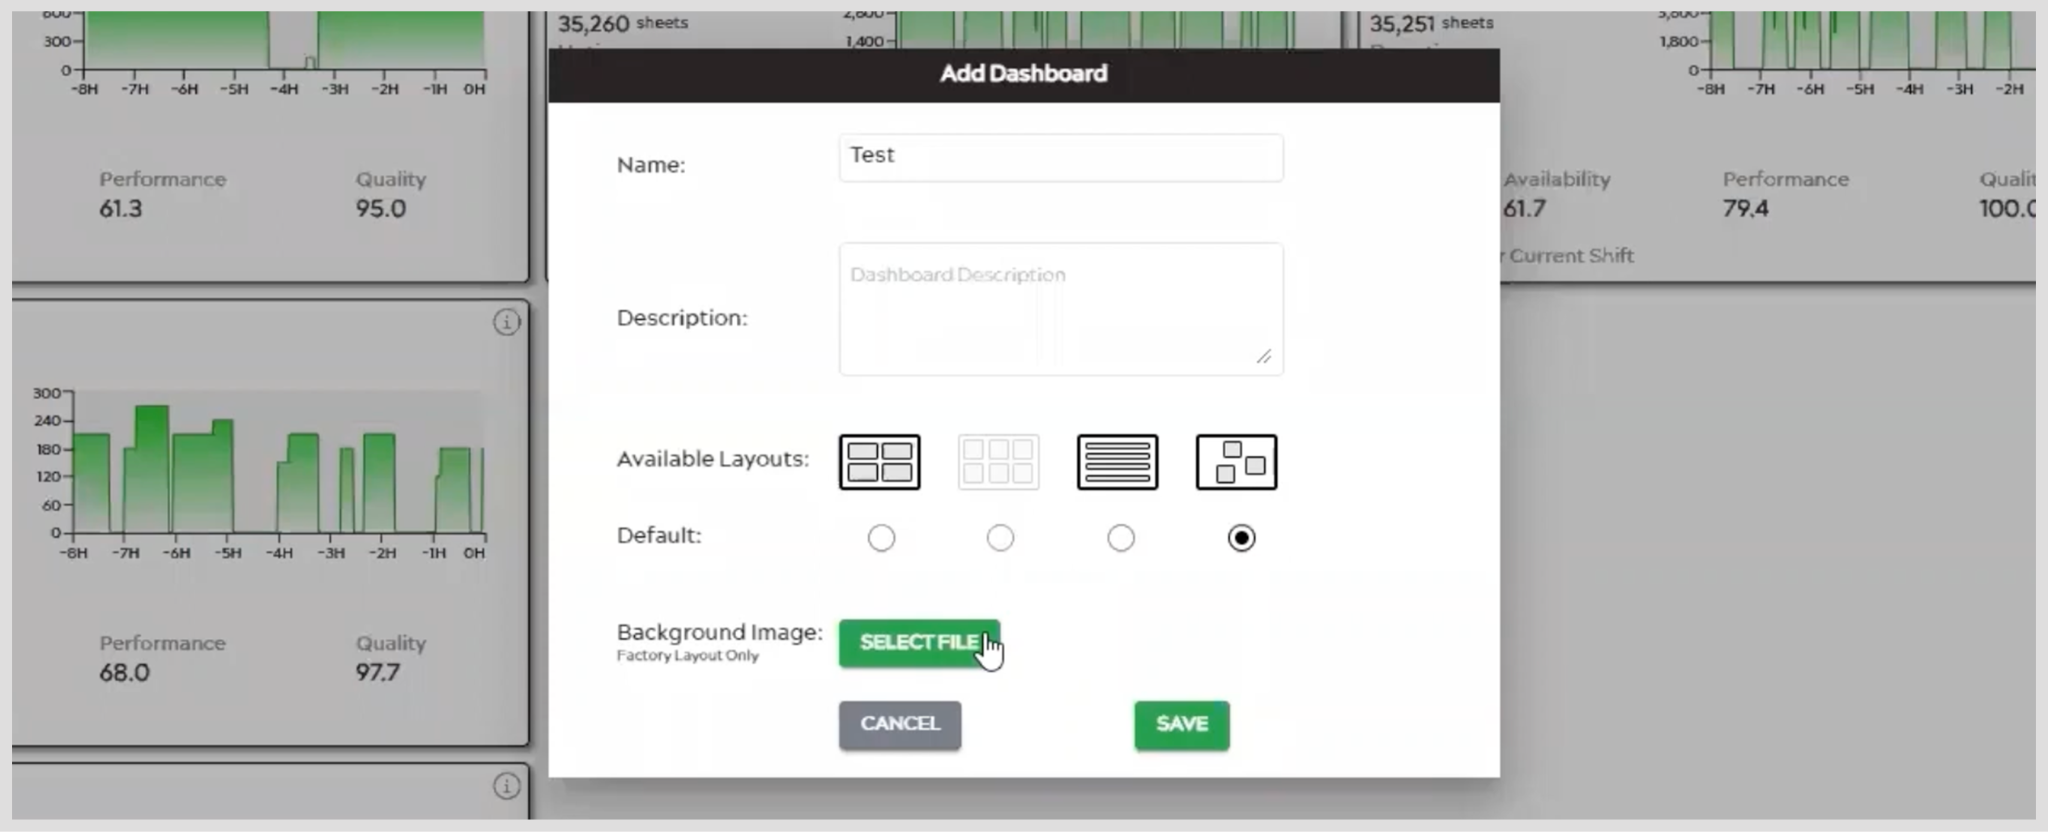
- Click Save to create the new dashboard.
3. Configuring Existing Dashboards:
- Select an existing dashboard from the Select Dashboard dropdown.
- Click the three dots icon in the top-right corner and choose Configure from the menu.
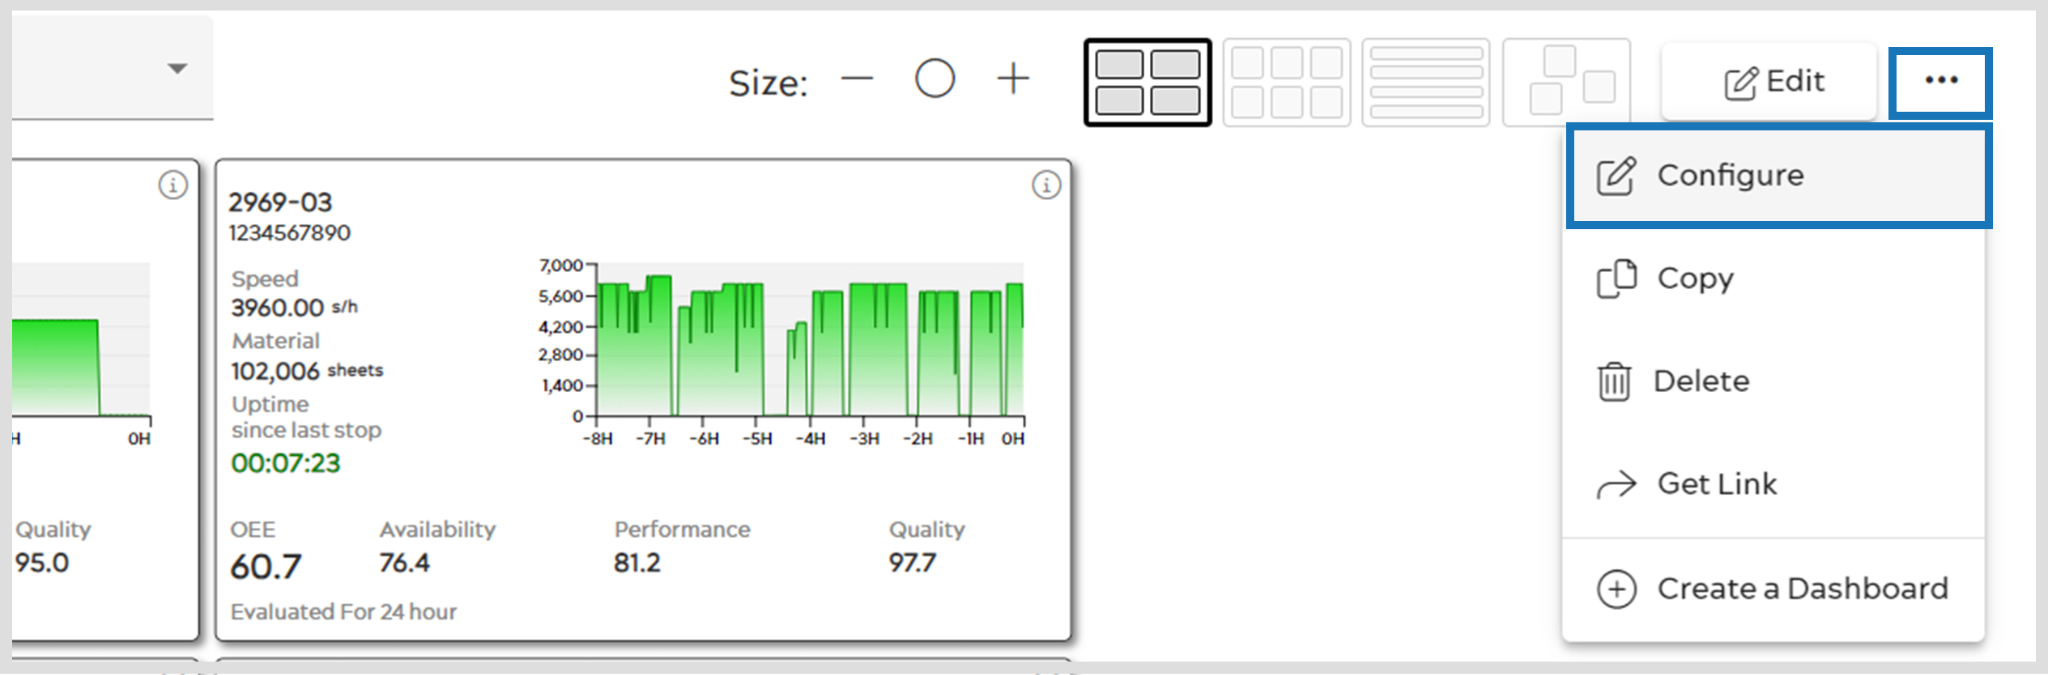
- In the “Configure Dashboard” popup, make changes to the dashboard’s settings.
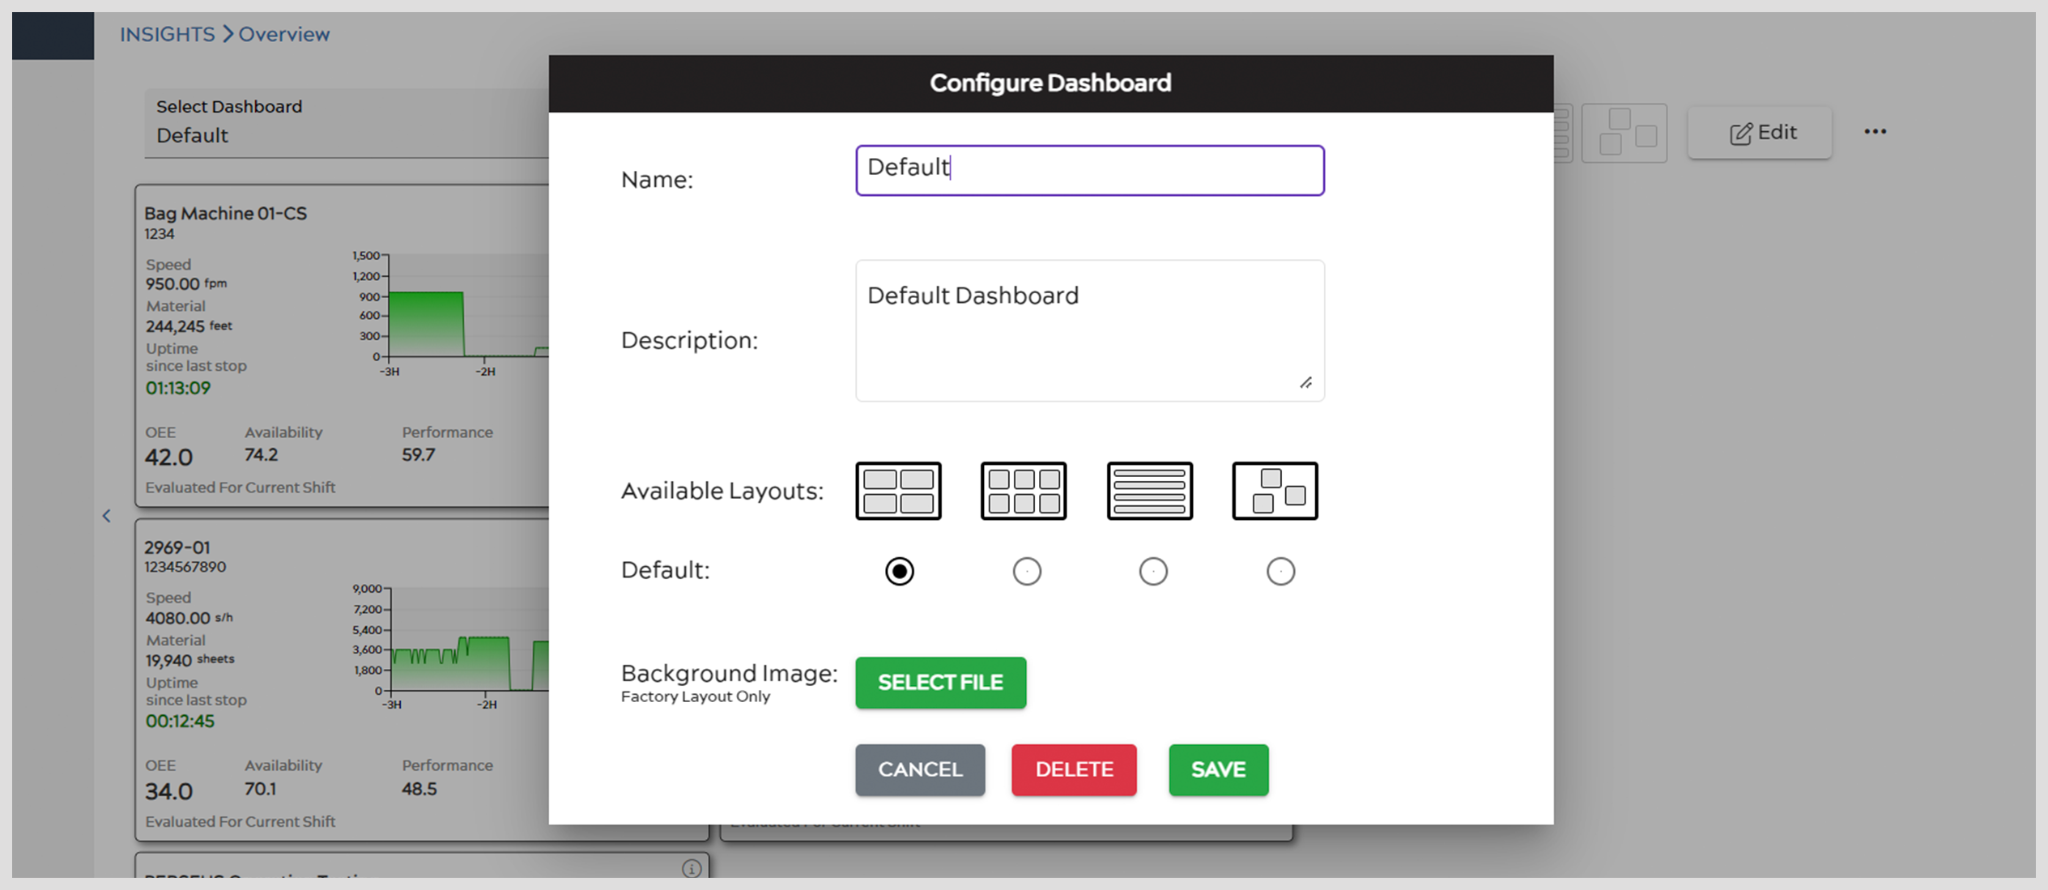
- Click Save to apply the configuration changes.
4. Customizing Dashboards:
- To make changes, switch to the Edit mode by clicking the Edit button in the top-right corner. Newly created dashboards are already in Edit mode.
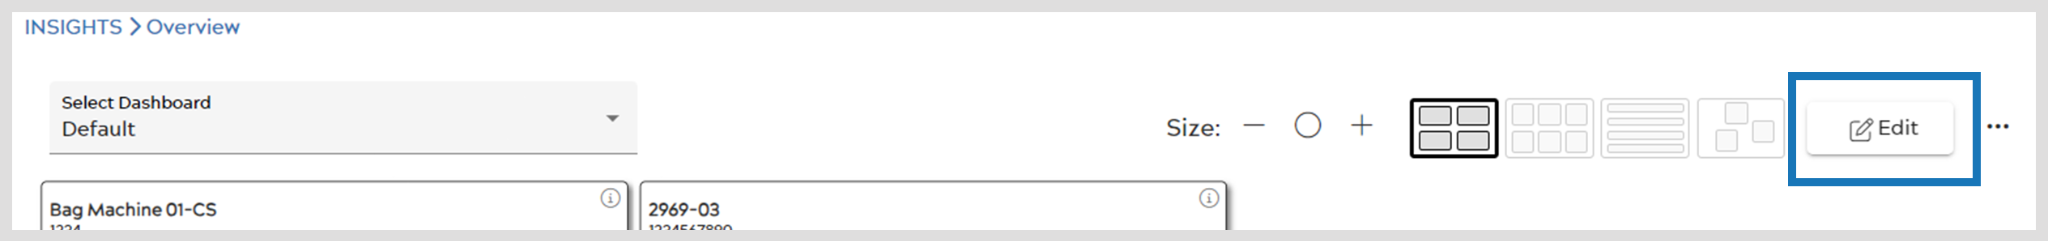
- In the Edit mode, you can modify and organize badges on the dashboard by dragging a badge and moving it to your preferred spot.
- To save changes made in the Edit mode, click the Done button in the top-right corner. Changes will be saved, and the dashboard will switch back to View mode.
5. Creating Badges:
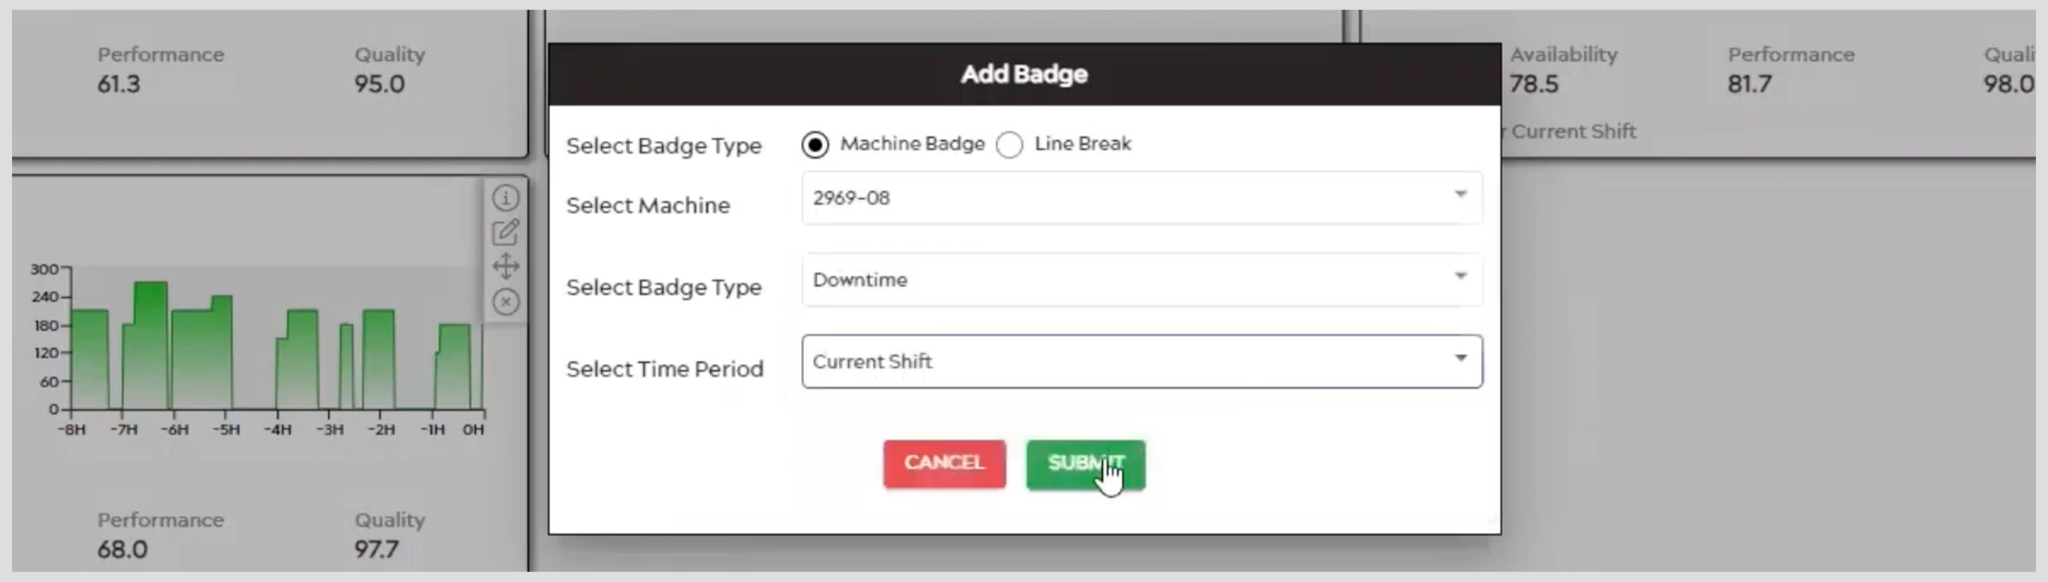
- While in Edit mode, click the Add Badge button to create a new badge.
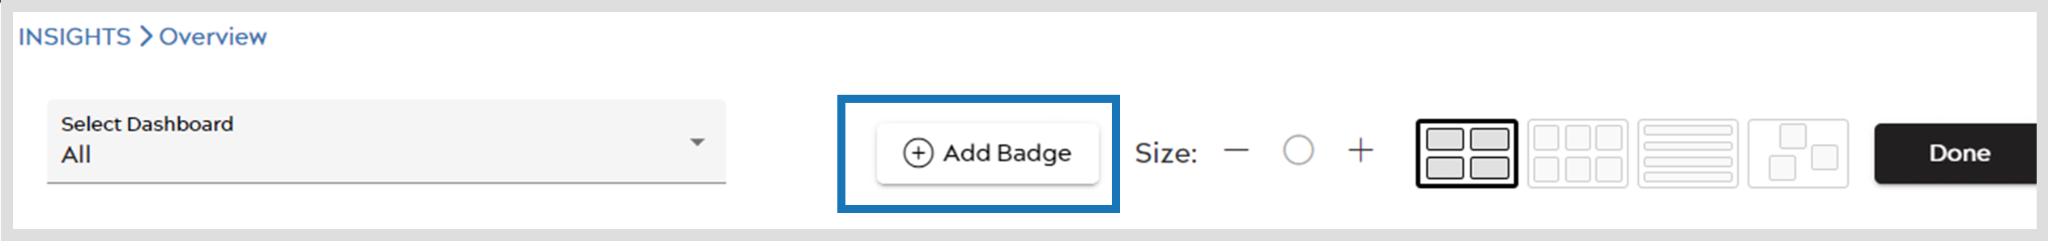
- In the “Add Badge” popup, select the badge type and machine(s) for the badge.
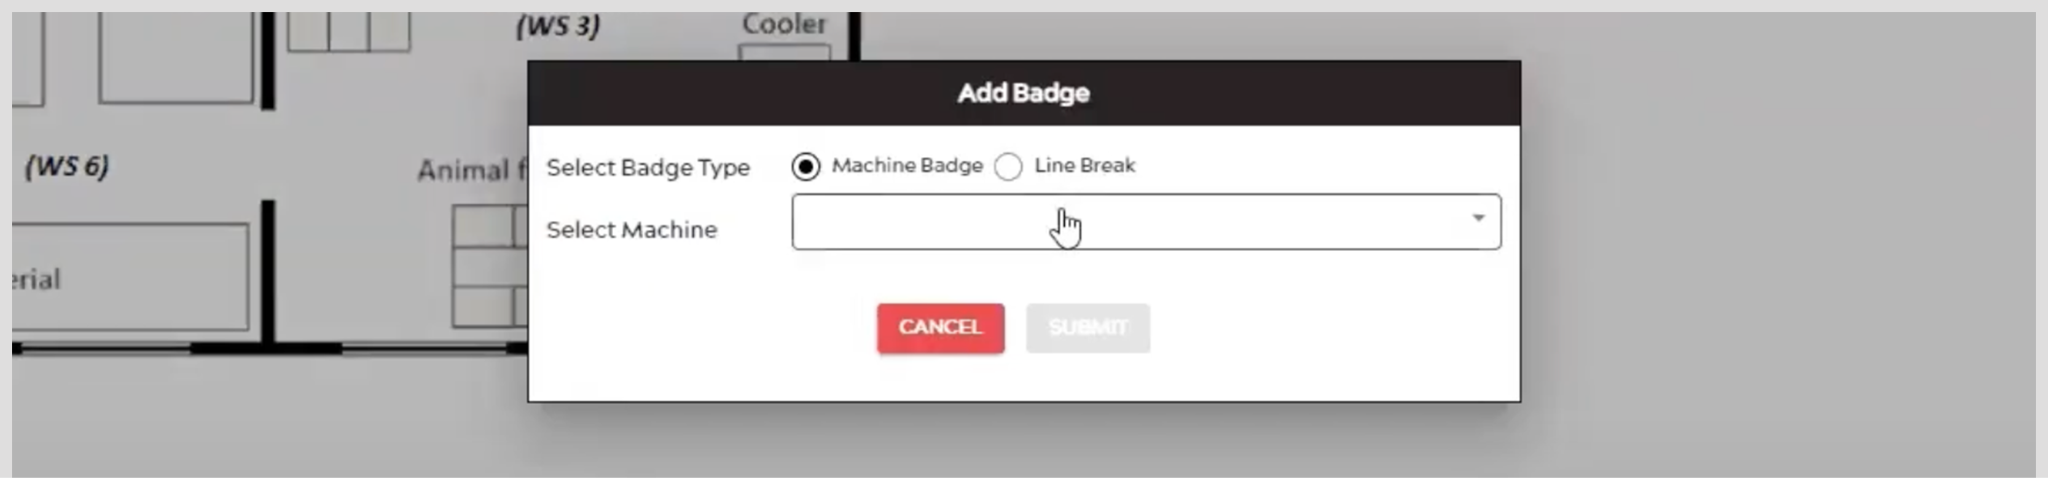
- For machine badges, choose the visualization type and additional parameters.
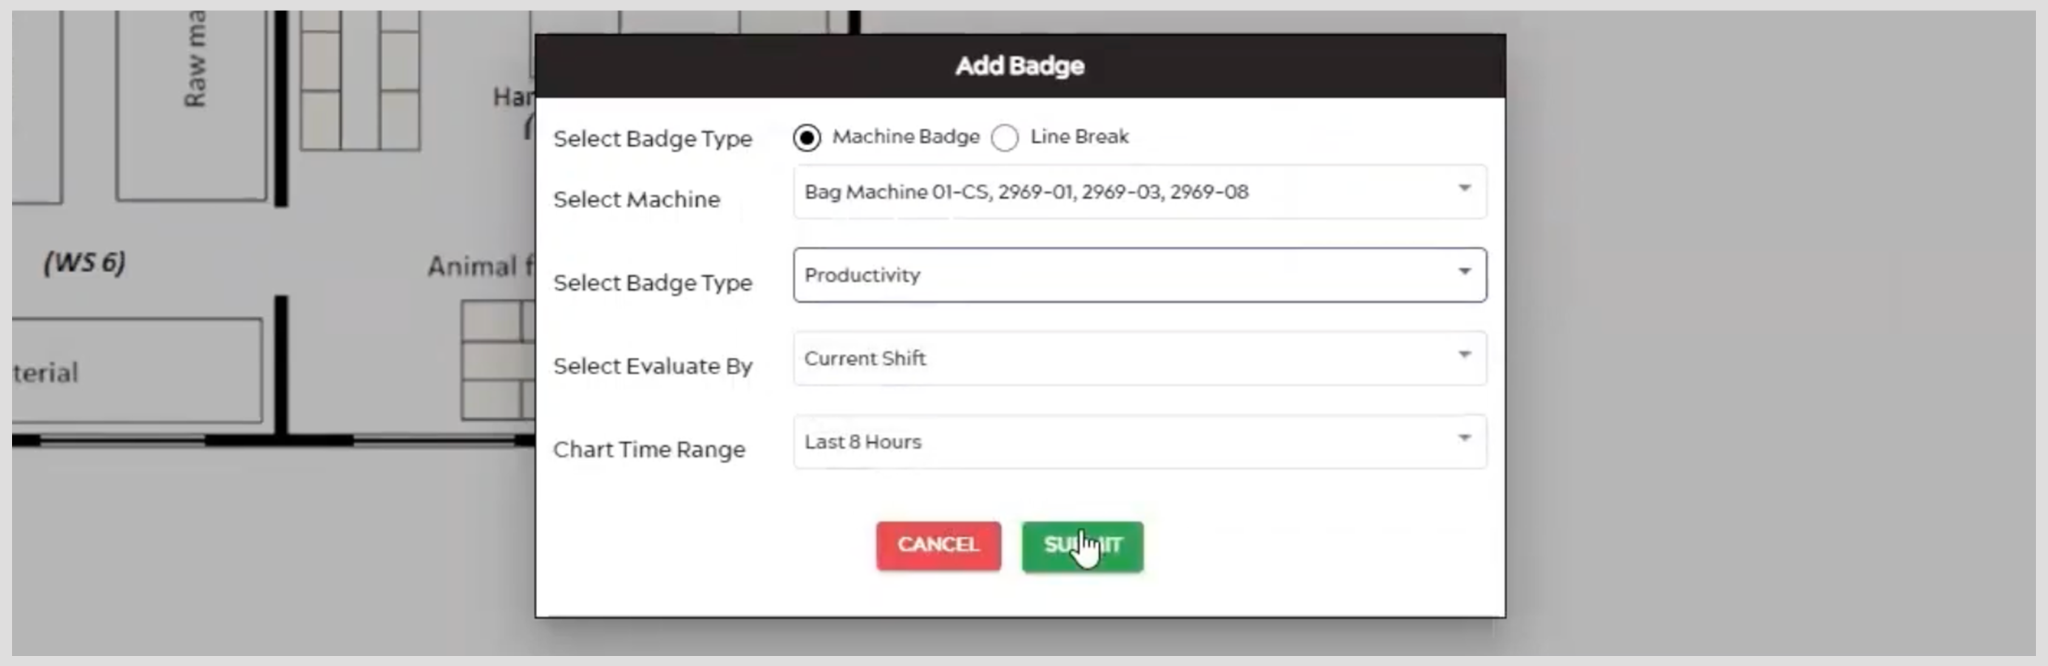
- Click Submit to add the configured badge to the dashboard.
