PRODUCTION
PRODUCTION makes it possible to view charts, export data, and run reports. PRODUCTION gives you the ability to chart multiple parameters, check historical data for quality defect information, and assess your process line’s productivity over time. The PRODUCTION function also allows you to measure the OEE of a machine, along with other factors such as performance, quality, and availability.
Note: for some OEMs, the PRODUCTION menu has a different name, e.g. FLEET VIEW.
Charts > Productivity
From the Production menu, selecting the Charts > Productivity option will open a customizable interactive chart which displays a machine’s OEE, Availability, Performance, and Quality over a certain time period.
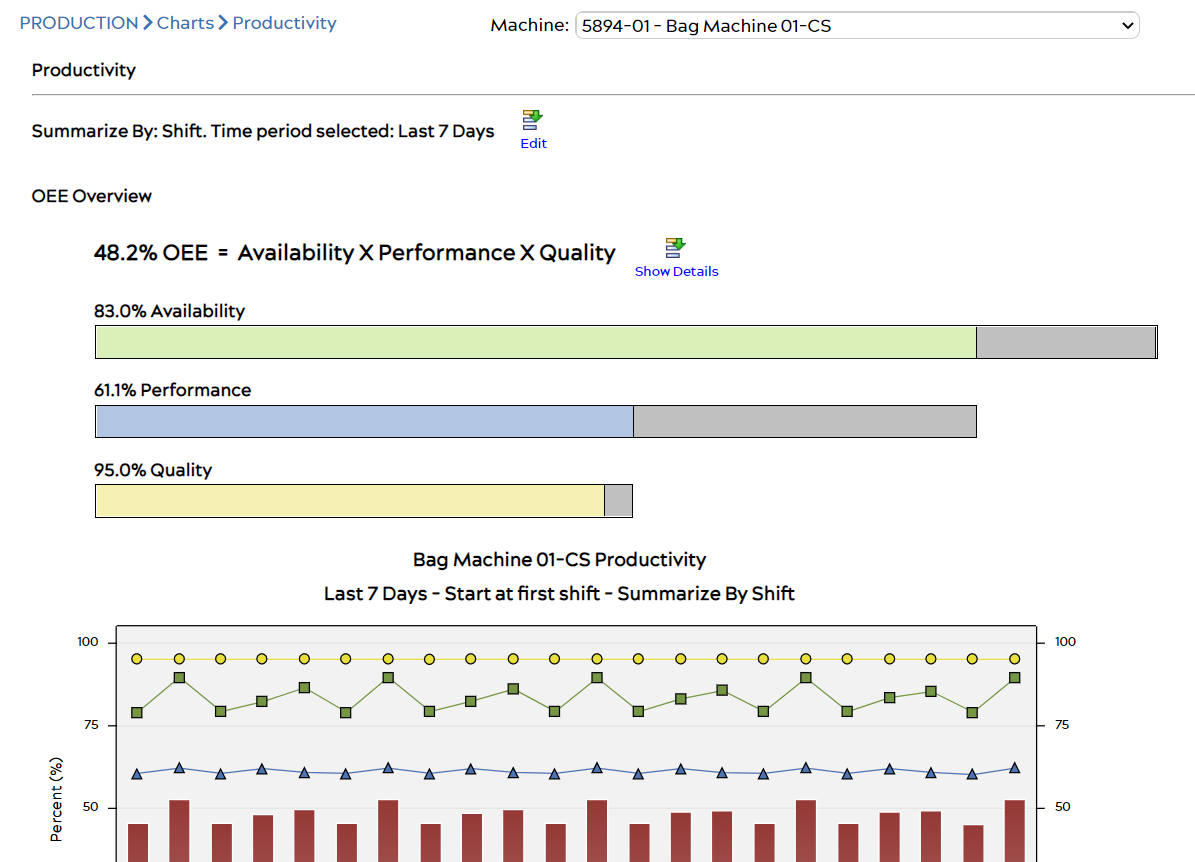
Clicking the Edit ![]() icon near the Summarize By section above the chart provides several selectable options which allow you to change the chart’s display of the time period, as well as the options to summarize by job, shift, or a period of time. Click the
icon near the Summarize By section above the chart provides several selectable options which allow you to change the chart’s display of the time period, as well as the options to summarize by job, shift, or a period of time. Click the ![]() icon to view a productivity chart based on the selected parameters, or save them for later use by pressing the Save icon.
icon to view a productivity chart based on the selected parameters, or save them for later use by pressing the Save icon.
If your chart is not showing data, or OEE values look incorrect, try the troubleshooting instructions included in this FAQ article.
Productivity Chart Details
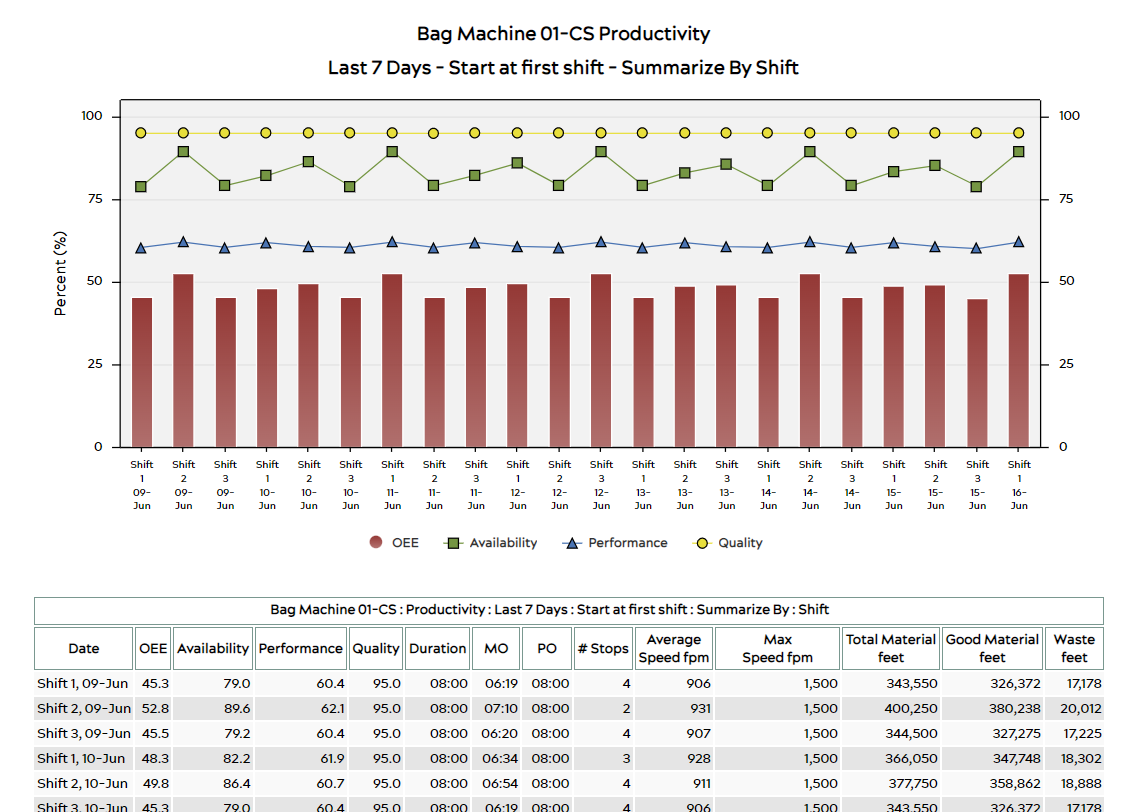
A sample Productivity Chart is shown above, listed by machine shifts. The following information is displayed in a table underneath, categorized by the chosen time period selection.
- Date: Shows the date of each point, and shift if necessary,
- OEE: Overall machine OEE for the day or shift.
- Availablility / Performance / Quality: Each of these three OEE metrics are listed individually.
- Duration: The length of each listed item is displayed here.
- MO: Machine Operating Time, which is calculated based on the number of minutes of collected machine production time.
- PO: Plant Operating Time, which is measured by the machine’s configured shift schedule.
- Average Speed: Speed average measured in the number of units over time. Varies per machine (in example above, this is shown in boxes per hour).
- Max Speed: The maximum speed listed for the selected item.
- Total Material: Total material count is shown here (may not be calculated or may be derived from other values based on machine data and sensors).
- Good Material: Total good material count is shown here (may not be calculated or may be derived from other values based on machine data and sensors).
- Waste: Total waste count is shown here (may not be calculated based on machine data and sensors).
Saving Charts
After generating a chart, the user can save it to the system or export it if desired. To save a chart to the system, click the Save button under a chart after it has been generated.
Export Data
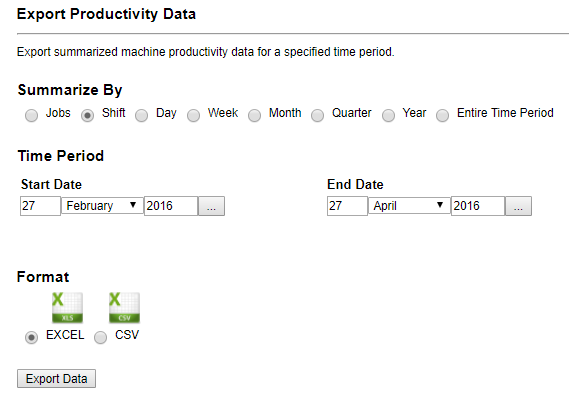
From the PRODUCTION menu, select the Export > Productivity Data option. This function generates a downloadable Excel or CSV file containing productivity and OEE data for the selected time period. You can read more about what’s included in these data exports here.
Export – Productivity Data
Reports
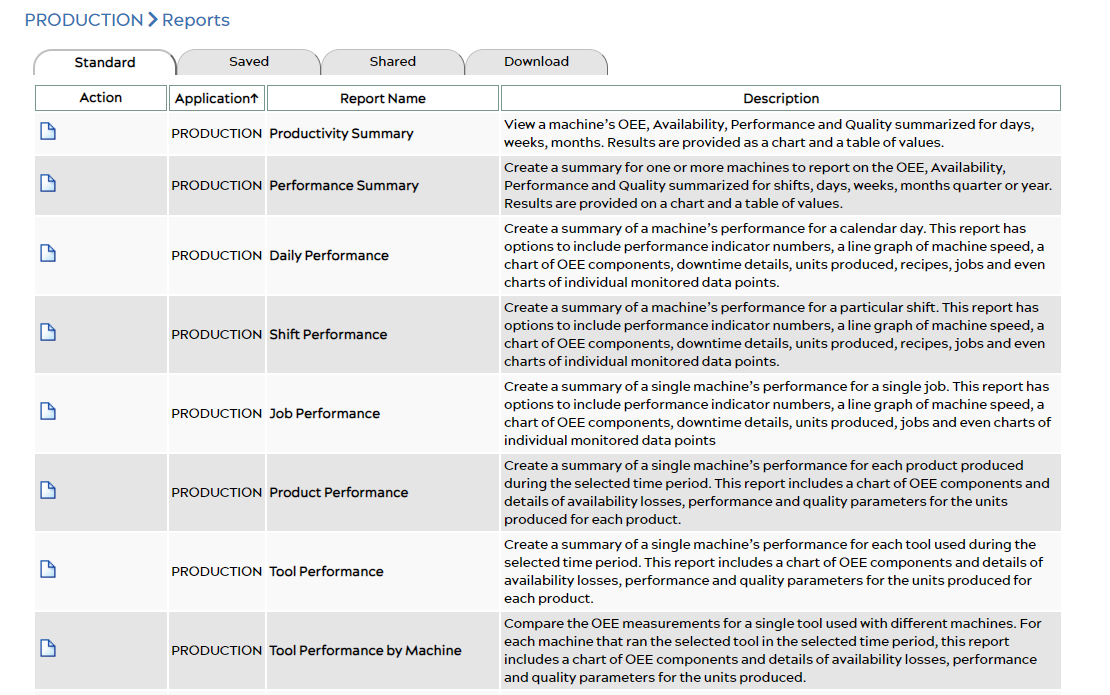
To run reports on productivity information, select the Reports option while in the Production menu.
See also:
