Introduction
Investigating issues impacting ei3 Amphion connections can be a significant challenge. To assist, ei3 has developed special troubleshooting tools. This document presents some of the available tools in detail.
The expected audience of this document is limited to ei3 SERVICE admin users, network engineers, and other IT staff who are familiar with advanced concepts related to device connectivity.
Notes
This article only applies to difficulties experienced with connectivity and communication with a machine’s devices. As such, the tools presented here are only applicable to red box Amphions (MRFDs) installed in a machine. It does not apply to green boxes (RSSDs) or black boxes. Also, these tools are primarily available in the Amphion S14-N. Amphion models A14-N and older either don’t have such tools or only have a significantly smaller subset of them.
The tools described in this article run on the Amphion itself, not in ei3’s cloud applications. This has important consequences: when attempting to use these tools, you must be connected to the Amphion either via an active Remote Service Session, or by physically connecting a laptop directly via ethernet cable to the Amphion’s “To Machine” port. This latter option is particularly valuable for service technicians and can be applied to situations when an Amphion is not accessible remotely.
Accessing the Tools
To access the troubleshooting tools remotely, you must first obtain the ei3 Argo IP address of your target Amphion by logging into the ei3 SERVICE application as an authorized admin user.
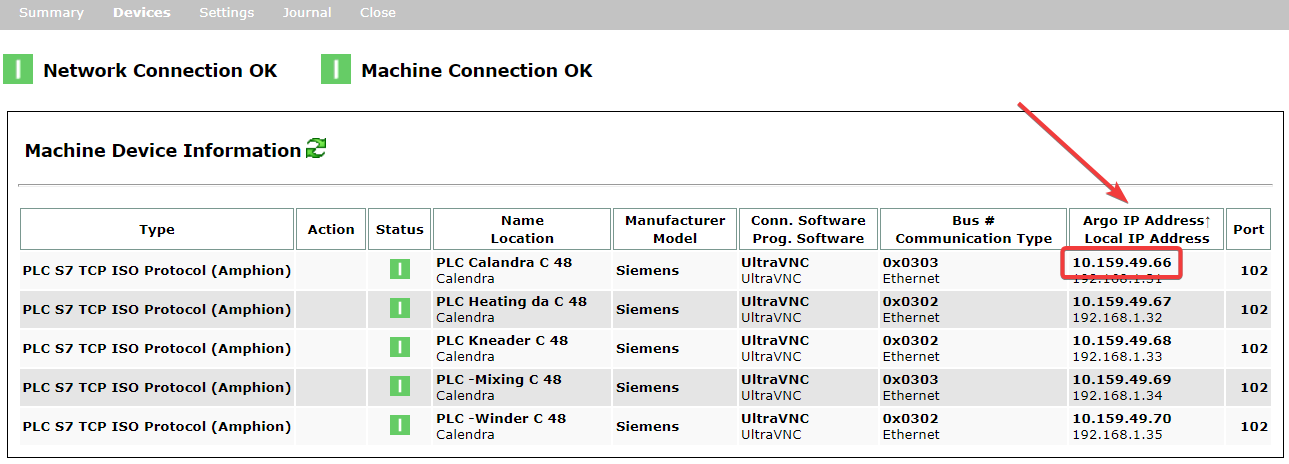
From the Machines page, find the corresponding machine and click on the Preview Machine icon ![]() , and then click on the Devices tab. This page will list all devices configured for the target red box.
, and then click on the Devices tab. This page will list all devices configured for the target red box.
Find the device with the lowest sequential IP address. The Argo IP of the red box itself will be this IP “minus one”, i.e. with
1 subtracted from the last number of the address. In the example below, the Argo IP of the Red Box is 10.159.49.65, as derived from the “lowest” device IP of 10.159.49.66 and subtracting 1 from 66 for the final octet:
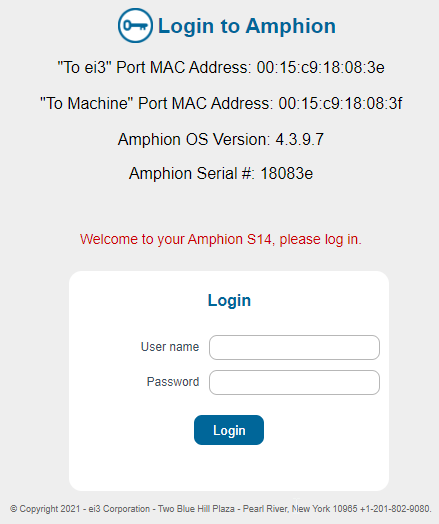
Once you have the Amphion S14’s Argo IP address, enter it in the address bar in a new tab of your browser of the computer with which you’re remotely connected in a SERVICE session (or the computer that is physically connected to the Amphion’s “To Machine” port). You will see a login page as shown below. The credentials to be used on this page must be obtained from ei3 CARE; please contact care@ei3.com.
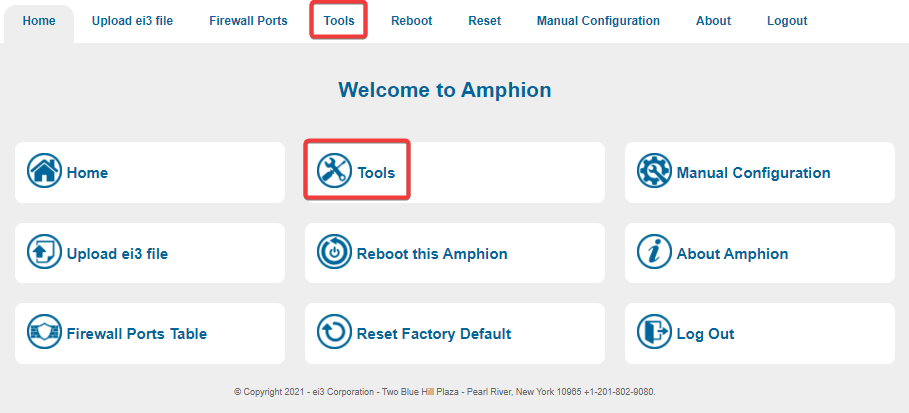
Once logged in, navigate to the Tools section. You can click on the tools icon or select it from the header menu on top of the home page:
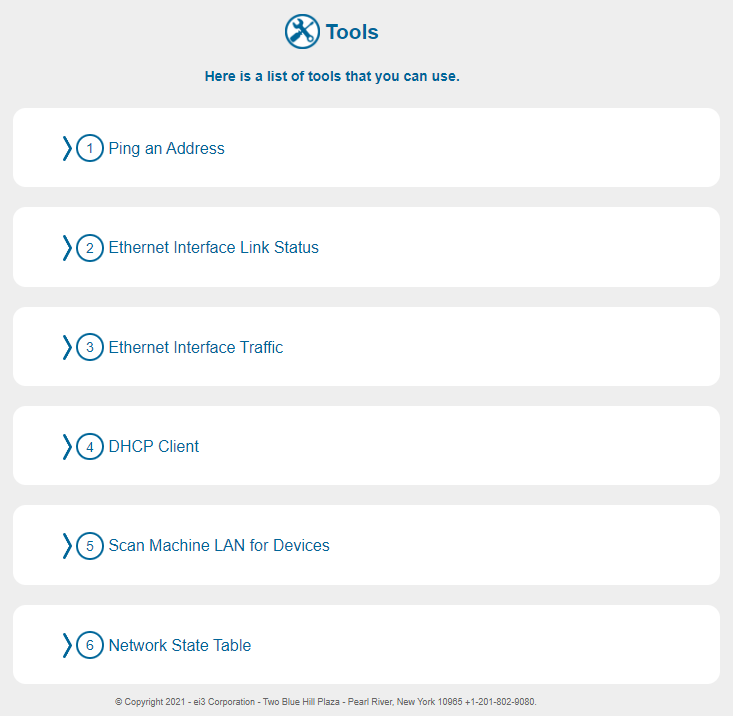
The Tools menu will display the list of available tools:
Ping an Address
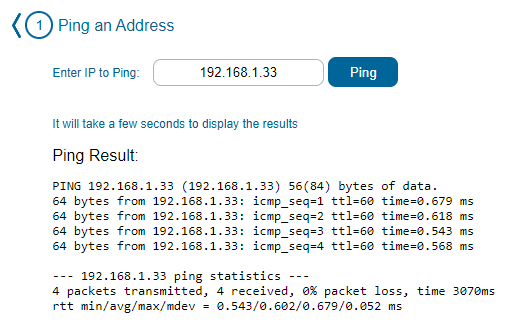
If you have a device on the Machine LAN and you would like to see if the Amphion is connected to it, this can be verified using this function. In most cases, being able to ping a device is a prerequisite for using this device for any purpose within ei3 (remote service, data collection, and so on). If you are having trouble connecting a device to ei3, “pinging” it is one of the first troubleshooting steps.
If you do not know the IP address of the device, go to Scan Machine LAN for Devices If you do know it, enter the local IP address (NOT the Argo IP address), then click Ping. After a few seconds, the response from the device will be displayed. Below is an example of a case where we can ping (i.e. reach) the device. You can tell the command was successful because the device responded to the ping command and 64 bytes were successfully transferred between it and the Amphion four times. The same can be seen in the summary: 4 packets transmitted, 4 received, 0% packet loss.
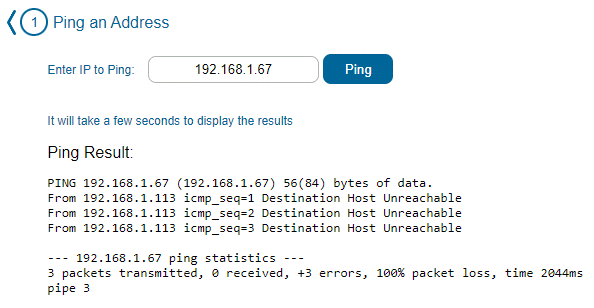
In a situation when the Amphion is unable to contact the device, you will see error messages (“Destination Host Unreachable” in the example below) and the summary will show that all packets were lost.
Ethernet Interface Link Status
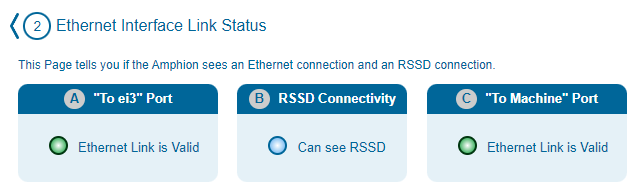
This tool provides an at-a-glance indicator of the current connection status of the Amphion device. It is intended to provide the same information as the LED lights on the front of your Amphion device. This tool can be used to indicate where a potential connection issue may exist. There are three indicator lights:
- “To ei3” port – This light indicator will either display as green (connected) or red (not connected), depending on whether there is a valid ethernet connection in the “To ei3” port. Red status may be caused by several factors, for example, a bad cable, a missing cable, incorrect connections in a local router or switch, or the presence of a firewall.
- RSSD Connectivity – This light indicator displays if there is a valid connection between the red box and the green box with which it’s configured to be used. The indicator will either display as blue (connected) or red (not connected). If this indicates that the red box (MRFD) cannot see its green box (RSSD), it could be because the red box and/or its associated green box is not configured correctly, or there could be a physical problem in the network between them.
- “To Machine” port – This light indicator will either display as green (connected) or red (not connected) if there is a valid ethernet connection in the “To Machine” port.
Please note that when accessing the troubleshooting page locally, using a laptop connected directly to the Amphion, the C indicator will always be green indicating the laptop is connected to it successfully.
If you are connecting to this page remotely, the A and B indicators will always be successful (green and blue, respectively).
Ethernet Interface Traffic
In some situations, it may be possible to “ping” a device located on the Machine LAN, but the device may appear to be non-operational in ei3 (for example, data may not be displayed). The Ethernet Interface Traffic tool can then be used to further diagnose such a problem.
This tool displays the total volume of all ethernet traffic (separated into sent and received) that went through each of the Amphion’s ports, in bytes. The number of packets blocked by the built-in firewall is also displayed. These counters are reset upon a reboot or reconfiguration of the Amphion device.
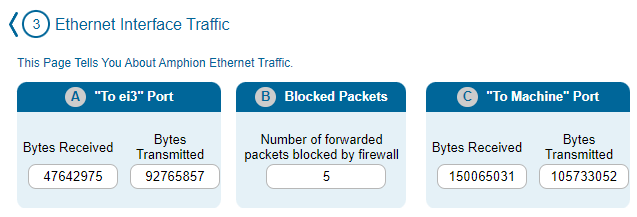
For example, if both Ports of the Amphion show active network traffic, that means that data is “flowing” from the device through the Amphion successfully. Hence if expected data for the machine is not appearing in ei3 this would then suggest that there may be a problem in the settings in ei3 (for example, data collection may be stopped or misconfigured). If, however, no data is “flowing” through the ports, it suggests that the root cause of the problem may lay in the Machine LAN (for example, a network switch that is not powered up or does not operate correctly) or in the target machine device itself.
Section “B” of this tool (“Blocked Packets”) allows the user to ascertain if any “through” traffic is being blocked (filtered out) by Amphion’s built-in firewall. This would confirm that undesired traffic is correctly being blocked, or it may help troubleshoot issues with edge devices located inside the Machine LAN such as a device attempting to use other ports.
DHCP Client
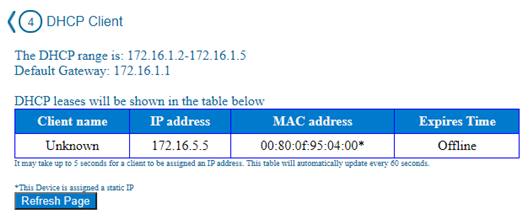
The Amphion hosts a Dynamic Host Configuration Protocol server (or DHCP server, for short). This means that, when you connect a device without a static IP address to the “To Machine” port of the Amphion, it will automatically get assigned an IP address. For example, if you connect your computer to this port, it will be assigned an address and will be able to communicate with the Amphion (see Notes at the beginning of this article). When connected to the Amphion this way, your computer will be listed among the “DHCP leases” displayed by the DHCP Client tool. (Note: if you don’t see your computer on this page in such a scenario, you may have assigned your computer a static IP address).
This tool provides the list of all DHCP IP Addresses that are active on the machine network. The name, IP address, MAC address, and expiry date of each lease are displayed in this table. (A DHCP lease is a temporary assignment of an IP address to a device on the network).
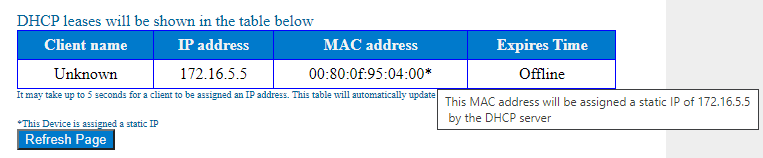
This tool is also useful to verify that a DHCP-enabled machine device was successfully assigned a static Argo IP by the Amphion when set up in its ei3 configuration to do that.
Please note that devices on the Machine LAN are usually assigned static IP addresses; in such cases, the DHCP Client tool will not display any information because there won’t be any DHCP leases. The DHCP feature of the Amphion is typically most useful when connecting a laptop to the red box directly, in order to perform advanced troubleshooting. The presence of the active DHCP lease in such cases will confirm that the Amphion is operating correctly.
You can also hover the mouse over the star symbol (*) in the MAC address to see more details if that entry is an assigned static IP address. This is useful to check if a desired configuration in which this is supposed to occur, as set up in ei3, was done successfully:
Scan Machine LAN for Devices
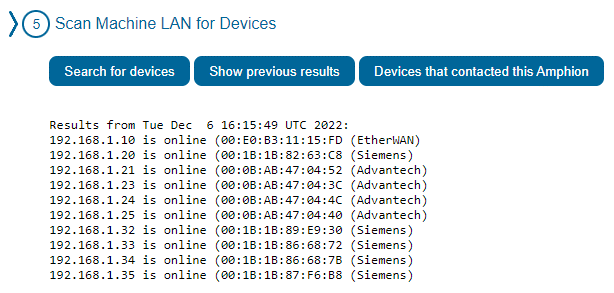
Sometimes it may happen that you do not know the IP address of a specific device on the Machine LAN, or that an IP address gets misassigned. The Scan Machine LAN for Devices tool is very helpful in such situations because it allows you to see a list of devices that are connected to the Amphion.
This tool has two variants. “Search for devices” will scan the machine LAN to look for all the devices typically used by our partners on the Machine LAN, irrespective of whether they have ever communicated with the Amphion. Keep in mind that this can take up to 15 minutes to complete this, depending on the network speed. Once the scan is completed, a list of the devices and their IP and MAC addresses will be displayed.

Another valuable benefit of this troubleshooting tool applies to situations when a range of expected IP addresses is missing from the list. This could indicate a problem with the physical machine network, such as an issue with one of the switches located inside the machine.
Aside from doing a full, time-consuming scan, you can also display the previous search results created using this function. Please note that if the Amphion is rebooted or reconfigured, it will forget the previous results.
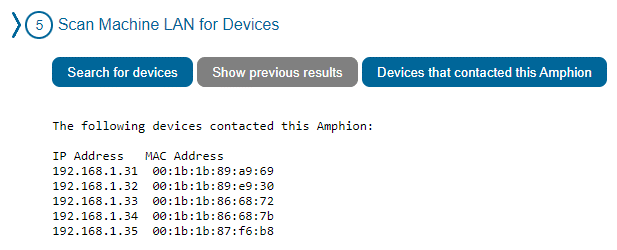
The other way of discovering devices installed in the Machine LAN is to check which devices have contacted the Amphion in the past. This operation is much faster than a full scan, but it may miss devices that have never attempted to connect to it. Even with this limitation, this function is useful in certain circumstances, e.g. to quickly obtain information about devices that are usually (or, are expected to be) installed in the Machine LAN.
Network State Table
If you want to see what connections are currently active on the Amphion, the Network State Table is the tool to use. This tool provides details about the active connections, by protocol and port; the source IP and destination IP are also included. Please note that data traffic funneled through the Amphion will also be shown here. This makes it suitable for troubleshooting issues with a machine or an edge device whose data traffic is expected to route through ei3 infrastructure, such as when using ei3 cloud-based data collection.
An example of the table is shown below:
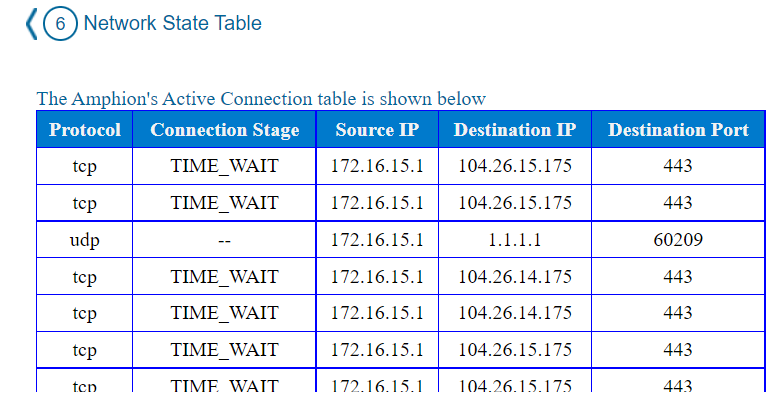
If the protocol is UDP, then there is no connection stage as shown in the example above.
The Network State Table automatically refreshes every 60 seconds.
Note: this tool is only available in Amphion S14s running software version 4.3.9.7 and above.
© 2023 ei3 Corporation. Content of this web page is proprietary to ei3 Corporation.
