When a machine (red box) or a network (green box) are offline in ei3, stopping you from performing remote service, the first thing to check are the physical aspects of the connection:
- Is the machine online?
- Are the Amphions online?
- Has anything been moved or reconfigured?
- Have there been any recent local network changes?
Further investigation can be performed using a specialized ei3 feature called the ping graph. Ping graphs present a visual representation of connectivity for both the network and the machine.
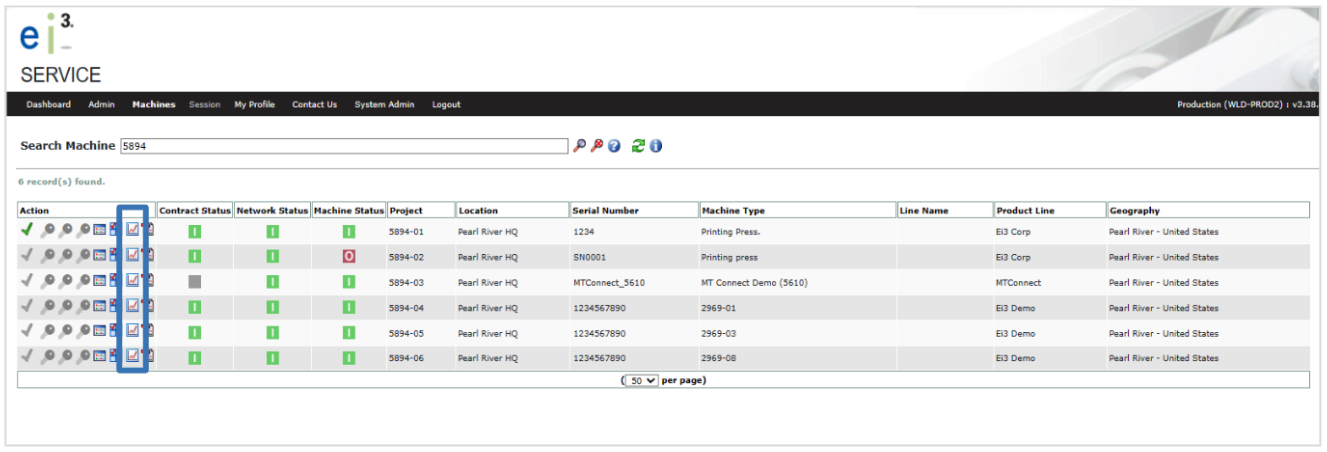
In SERVICE, ping graphs can be accessed by clicking the icon near the machine of interest on the Search Machine results page. A pop-up window will open displaying two ping graphs (explained below).
Network Ping Graph (Top) – The top ping graph represents the Internet VPN Connection of Amphion on Customer’s Network, i.e. the connection between the green box and ei3’s cloud infrastructure.
Machine Ping Graph (Bottom) – The bottom ping graph represents the Amphion Firewall Connection to Machine LAN and Devices, i.e. the connection between the red box and the green box over the Shop Floor LAN.
Note: all dates and times shown on the graphs are in the UTC time zone.

Ping (Blue) – The blue line on the graph represents the connectivity state of the connection. When the connection is online, then the value is 1, when the connection is offline, then the value is 0. Typical reasons for an offline connection are when the Amphion is powered off, the cable is disconnected or there is an issue with the configuration of the local network.
Ping Response (Black) – The black line on the graph represents the average time (in seconds) for a network ping to be responded to by the Amphion. Lower ping response times represent a healthy network connection and are therefore better than longer ones.
When both the blue and black line on the graph drop to zero, it means that the connection was not available at that time. This way, the graphs will let you, for example:
- Find out that the machine or an Amphion was “down” at a certain time in the past, and how long they were down for.
- If the connection is currently unavailable – find out when this problem started.
- Obtain basic information about the network stability. If the lines go up and down a lot, it indicates an unstable local network.
- Obtain information about network speed. If the ping response values are unusually high, you may experience bandwidth limitations during your remote sessions.
Please discuss any anomalies with your local IT team.
Furthermore, you can ask your ei3 admin to set up an alert to notify you when the connection becomes available again; see APPENDIX 3: Machine Connection State Alerts for more information.
Time Period Selection: Year, Month, Week, Day, Hour, Custom – Radio button selections are available to examine connectivity graphs over various time periods.

Refresh – The refresh button will cause the ping graphs to be refreshed with the most recent data.
Print – The print button will present the web browser’s print dialog.
© 2023 ei3 Corporation. Content of this web page is proprietary to ei3 Corporation.
