- Productivity Dashboard
The Dashboard tab of PRODUCTION allows users to get a deeper look at the statistics of an individual machine. Use the machine selection bar at the top of the page to select a machine and view its performance statistics.
To view your Production Dashboard, first, navigate to PRODUCTION > Dashboard from the top menu bar, and a page similar to the one below will appear. First, select the machine you want to analyze from the dropdown menu at the top of the page.
On this page, there are four sections: Production, Trends, Service, and Connected Service Plans.
Production
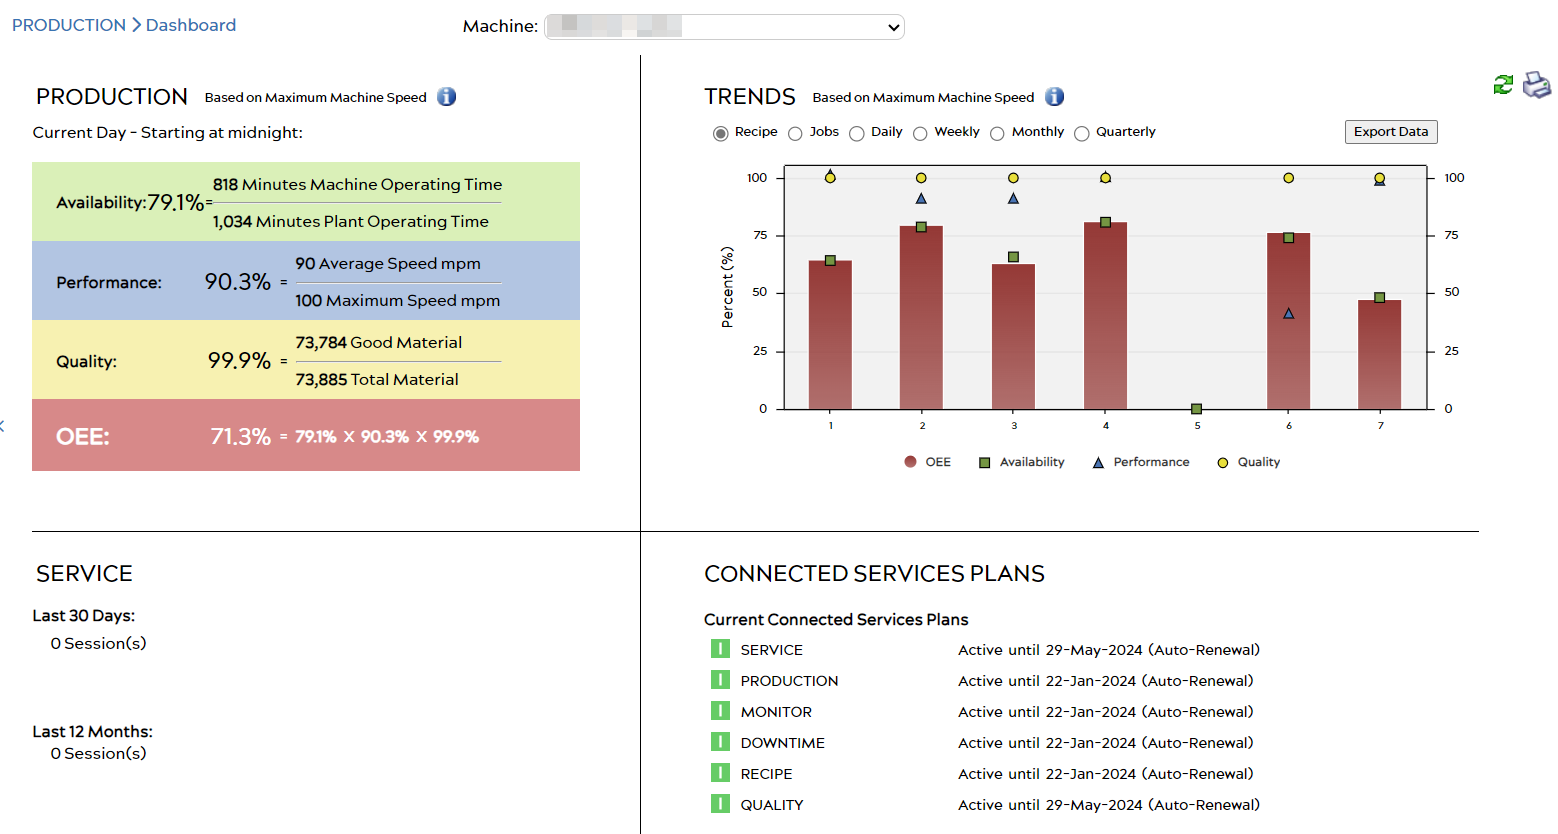
The Production section displays the machine’s production statistics over the past 24 hours. This section includes important information involving the machine’s OEE (Overall Equipment Effectiveness), which is made of three main components: Availability, Performance, and Quality. These factors are used together to calculate a machine’s OEE.
- Availability – In this section, the machine’s operating time is compared with the Plant’s operating time. A percentage value is shown signifying the amount of time the machine has been in operation versus the overall plant operation time.
- Performance – Performance is calculated by the machine’s average speed (in measured units) over its maximum speed.
- Quality – Quality is calculated by measuring the amount of good material produced divided by the total amount of material. These numbers can be edited in the Job Management menu to allow for manual input of other important values such as scrap material.
Trends
The Trends graphs provide information on your machine’s OEE over time. By selecting a time interval from the buttons above the graph, you can easily change the time period you would like to view.
Additionally, the Jobs and Recipes selection allows you to view each of the machine’s jobs, as well as the OEE for each. Instead of using time values for the X-axis, the graph will display a list of the machine’s most recent jobs. The information in this section can easily be exported to your device with the Export Data button.
Service & Connected Services Plans
At the bottom of the page, there is more general information regarding the Service Sessions that have been done on the machine. You can also see your Service Plan, which includes the current applications that you have running on your machines and the applications that you do not have a plan for.
