This feature requires API Access and Downtime enabled on your machine, and the Customer Portal and Downtime permission levels for the associated user account(s) need to be set to Read only and Read/Write in order to access the tablet mode. Read more about changing user permission levels in this article.
Accessing Downtime Tracker
To access Downtime Tracker in Tablet Mode:
- Login to the Customer Portal, select your machine, and navigate to the Downtime.
- Select the
 icon from the top left, above the downtime histogram.
![]()
Alternatively, you can access this page directly by entering the URL to your address bar: https://web.ei3.com/downtime/#/Your_Company_Name_Here/login
- Login with your username and password.
- The Downtime for Tablet application should display in your browser.
Overview – Layout & Functions
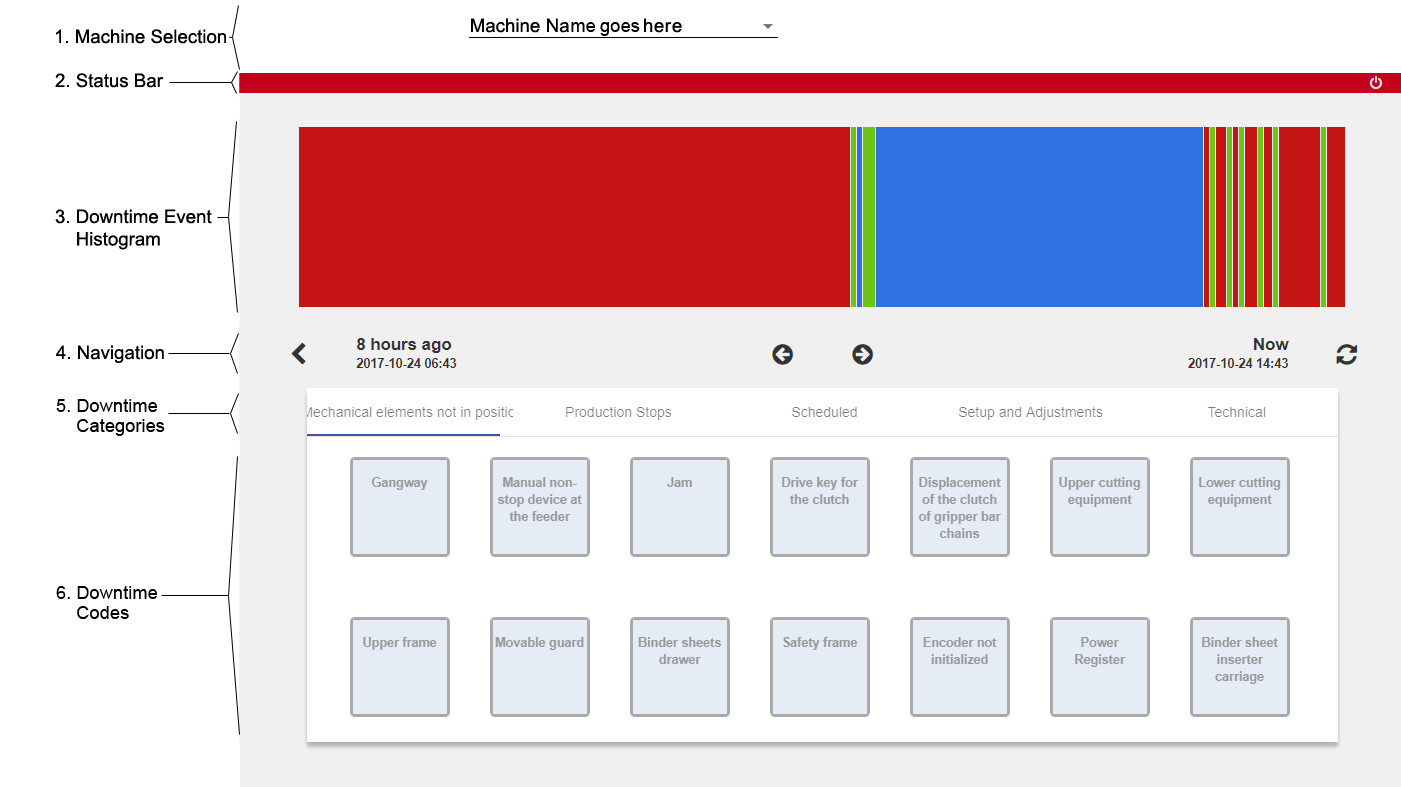
Machine Selection and Status Bar
Use the selection menu at the top of the page to select a machine to view.
The status bar running across the page underneath the machine selection menu, displays important messages and allows users to log off after using the application.
Downtime Event Histogram
The histogram shows the selected machine’s most recent uptime and downtime events. Green sections display a machine’s normal run time, blue sections indicate assigned downtime, and red sections represent unassigned downtime for the machine. The histogram display will default to showing the last eight hours of machine time, but this time frame will change to match on the size of your device’s screen.
Navigation
Histogram display navigation: The ![]() and
and ![]() buttons allow you to navigate backwards or forwards between downtime periods.
buttons allow you to navigate backwards or forwards between downtime periods.
Refresh manually: ![]() refreshes the histogram, should the need arise, although histogram data should automatically update once per minute.
refreshes the histogram, should the need arise, although histogram data should automatically update once per minute.
Selection arrows: The ![]() and
and ![]() buttons navigate from one downtime event selection to the next. On mobile devices and tablets, downtime events can be selected with the touch screen, however, these buttons allow for easier selections in areas with smaller, harder-to-select downtime events on the histogram.
buttons navigate from one downtime event selection to the next. On mobile devices and tablets, downtime events can be selected with the touch screen, however, these buttons allow for easier selections in areas with smaller, harder-to-select downtime events on the histogram.
Downtime Categories & Downtime Codes
Beneath the histogram, downtime code boxes are displayed, sorted by downtime category (listed in the bar above the downtime codes). These codes can be assigned to downtime events on the histogram. Scroll through downtime category tabs by clicking the arrow icons in that row.
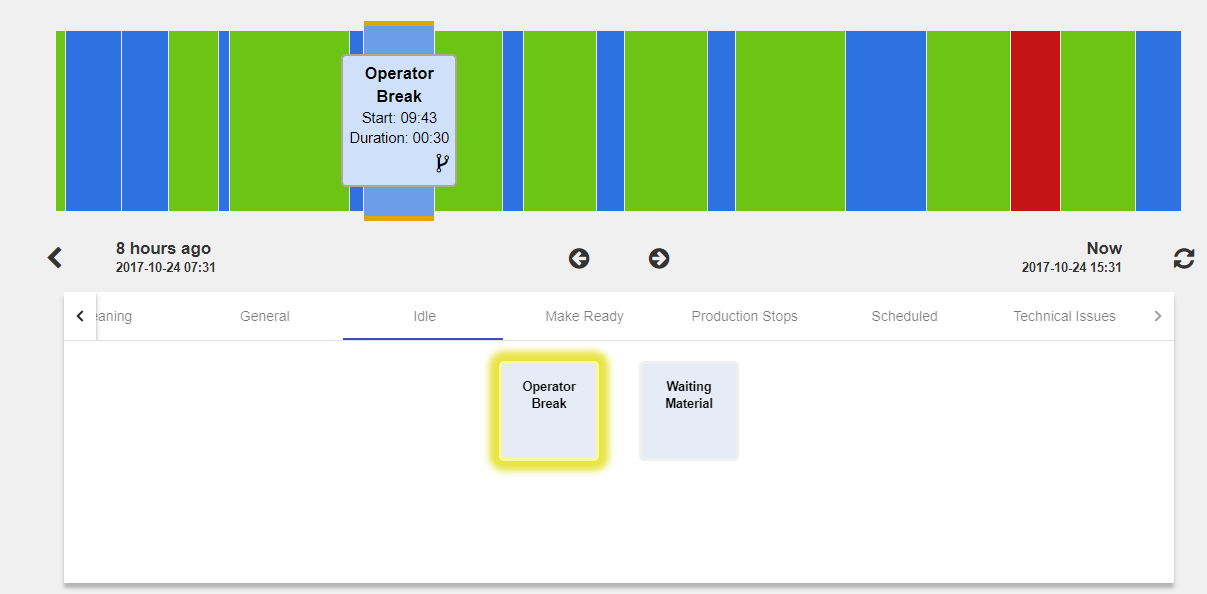
Inspecting DT events
Use the navigation buttons or click to select a specific downtime event. Selecting a downtime event displays its title, start time, and duration.
Selecting an assigned downtime event will highlight its assigned downtime code from the list of codes in the boxes below.
Some downtime codes require users to input notes, and will not save unless a note has been entered. These downtime codes are shown with a ![]() icon on them. To learn more about downtime codes with notes, see the Downtime Notes section below.
icon on them. To learn more about downtime codes with notes, see the Downtime Notes section below.
Assigning Downtime
To assign downtime to an unassigned downtime event (shown in red):
- Select the desired downtime event using the selection arrows or by tapping it.
- Select the necessary downtime code from the boxes underneath.
- A “Save Successful” message should display on the left side of the status bar.
Downtime Notes
When selecting a downtime code which requires a note, follow the steps for assigning downtime as normal. Upon selecting a downtime code which requires a note, a notepad window will appear. Enter your note, then tap Save.
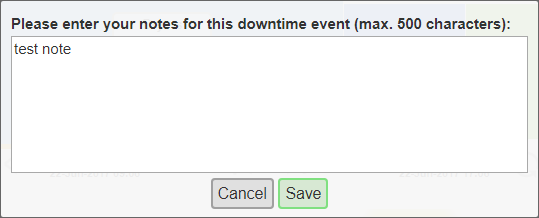
Important: If no note is entered for a downtime event that requires one, the selected downtime code will not be assigned.
Editing & Viewing Notes
To view a downtime note, select the downtime event from the histogram. Click the ![]() icon to view or edit the note for the selected downtime event.
icon to view or edit the note for the selected downtime event.
Unassigning Downtime
To unassign a downtime code from a downtime event:
- Select the downtime event.
- The designated downtime code for the selected event will be highlighted in the boxes below.
- Click the designated downtime code box to unassign it from the downtime event.
- The downtime event color should change from blue to red, indicating that it has been reverted to unassigned downtime.
Splitting Downtime
Downtimes can be split if necessary. To split a downtime event:
- Assign a downtime code to the first downtime as normal, then tap the
 icon
icon - A Split time interface will appear, prompting you to choose a split time.
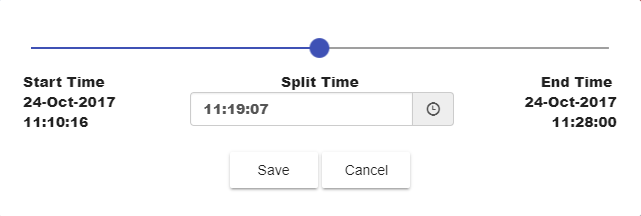
- Split times can be entered using the slider bar, arrow markers, or by typing into the input boxes.
- Hit Save, and the downtime should now be split into two separate downtimes.
- Assign a second downtime code to the newly split section.
See also: Performance & Downtime
